

Question: begin{tabular}{|c|c|c|} hline multirow{3}{*}{% Deviation from Base Case } & Variable costs & per unit, Year 1 cline { 2 - 3 } & Base
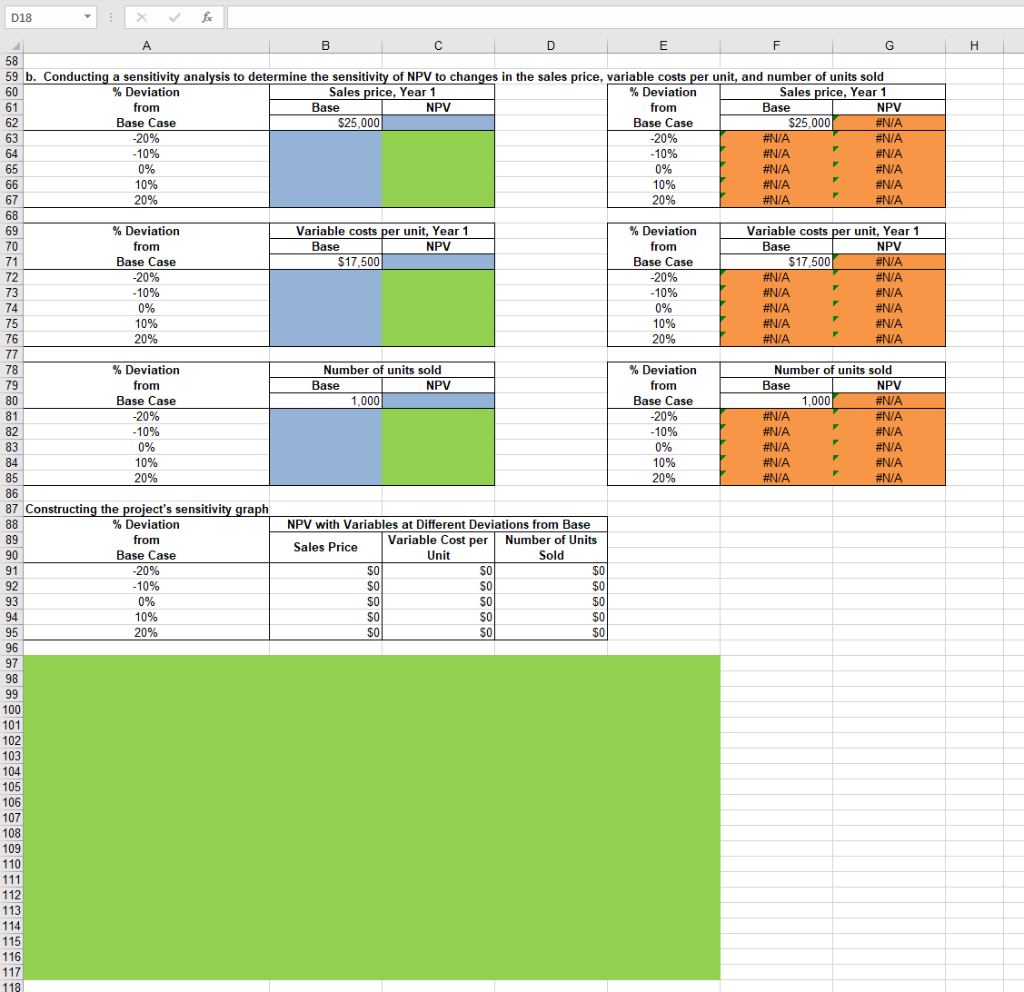
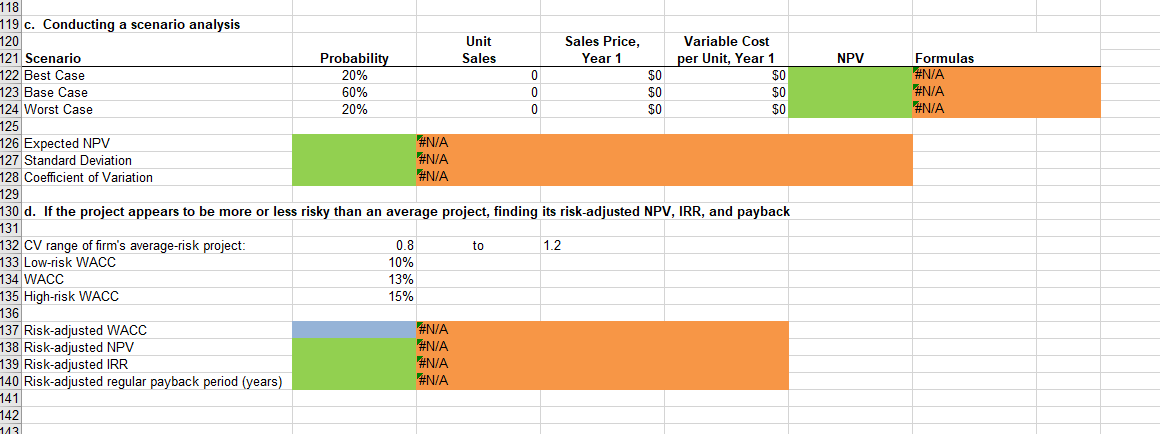
\begin{tabular}{|c|c|c|} \hline \multirow{3}{*}{% Deviation from Base Case } & Variable costs & per unit, Year 1 \\ \cline { 2 - 3 } & Base & NPV \\ \hline20% & #17,500 & #N/A \\ \hline10% & #N/A & #N/A \\ 0% & #N/A & #N/A \\ \hline 10% & #N/A & #N/A \\ 20% & #N/A & #N/A \\ #N/A & #N/A \\ \hline \end{tabular} Constructing the project's sensitivity graph 96 d. If the project appears to be more or less risky than an average project, finding its risk-adjusted NPV, IRR, and payback \begin{tabular}{|c|c|c|} \hline \multirow{3}{*}{% Deviation from Base Case } & Variable costs & per unit, Year 1 \\ \cline { 2 - 3 } & Base & NPV \\ \hline20% & #17,500 & #N/A \\ \hline10% & #N/A & #N/A \\ 0% & #N/A & #N/A \\ \hline 10% & #N/A & #N/A \\ 20% & #N/A & #N/A \\ #N/A & #N/A \\ \hline \end{tabular} Constructing the project's sensitivity graph 96 d. If the project appears to be more or less risky than an average project, finding its risk-adjusted NPV, IRR, and payback
Step by Step Solution
There are 3 Steps involved in it

Get step-by-step solutions from verified subject matter experts