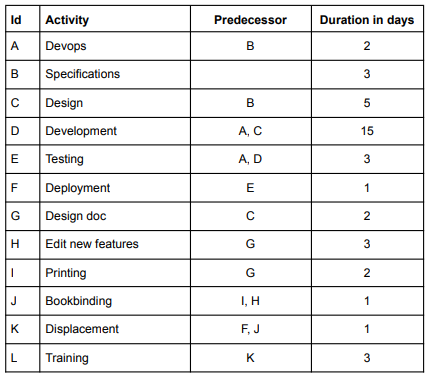
Question: begin{tabular}{|l|l|c|c|} hline Id & Activity & Predecessor & Duration in days hline A & Devops & B & 2 hline B & Specifications

\begin{tabular}{|l|l|c|c|} \hline Id & Activity &

\begin{tabular}{|l|l|c|c|} \hline Id & Activity &

\begin{tabular}{|l|l|c|c|} \hline Id & Activity &

\begin{tabular}{|l|l|c|c|} \hline Id & Activity & Predecessor & Duration in days \\ \hline A & Devops & B & 2 \\ \hline B & Specifications & & 3 \\ \hline C & Design & B & 5 \\ \hline D & Development & A, C & 15 \\ \hline E & Testing & A, D & 3 \\ \hline F & Deployment & E & 1 \\ \hline G & Design doc & C & 2 \\ \hline H & Edit new features & G & 3 \\ \hline I & Printing & G & 2 \\ \hline J & Bookbinding & I, H & 1 \\ \hline K & Displacement & F, J & 1 \\ \hline L & Training & K & 3 \\ \hline \end{tabular} \begin{tabular}{|l|l|c|c|c|} \hline Id & Activity & Status & % completion & Real durations in days \\ \hline A & Devops & Completed & 100% & 1.5 \\ \hline B & Specifications & Completed & 100% & 3.2 \\ \hline C & Design & Completed & 100% & 5.4 \\ \hline D & Development & In progress & 80% & 10 \\ \hline E & Testing & Not started & & \\ \hline F & Deployment & Not started & & 4.5 \\ \hline G & Design doc & Completed & 100% & 4 \\ \hline H & Edit new features & In progress & 90% & \\ \hline I & Printing & In progress & 25% & \\ \hline J & Bookbinding & Not started & & \\ \hline K & Displacement & Not started & & \\ \hline L & Training & Not started & & \\ \hline \end{tabular} In taking as activities planification the quantities used in the PERT table, as well as an average cost of resources of 250$ a day (we take into account only resources of type Labor), compute at that execution moment the following indicators: 1. The Planned Value (PV) 2. The Actual Cost (AC) 3. The Earned Value (EV) 4. The BAC (Budget At Completion) 5. The Schedule Variance (SV) 6. The Cost Variance (CV) 7. The SPI (Schedule Performance Index) 8. The CPI (Cost Performance Index) 9. The PPI (Project Performance Index) 10. The EBAC (Estimated Budget At Completion) 11. What can you say about the health of that project? For questions 1 to 10 , give answers within a table (item, value)

Step by Step Solution

There are 3 Steps involved in it

1 Expert Approved Answer
Step: 1 Unlock blur-text-image
Question Has Been Solved by an Expert!

Get step-by-step solutions from verified subject matter experts

Step: 2 Unlock
Step: 3 Unlock

Students Have Also Explored These Related General Management Questions!