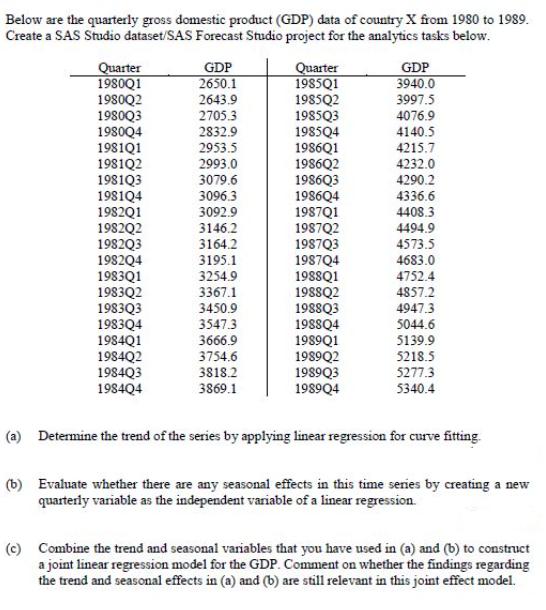
Below are the quarterly gross domestic product (GDP) data of country X from 1980 to 1989....
Fantastic news! We've Found the answer you've been seeking!
Question:
Transcribed Image Text:
Below are the quarterly gross domestic product (GDP) data of country X from 1980 to 1989. Create a SAS Studio dataset/SAS Forecast Studio project for the analytics tasks below. Quarter 1980Q1 1980Q2 1980Q3 1980Q4 1981Q1 1981Q2 1981Q3 1981Q4 1982Q1 1982Q2 1982Q3 1982Q4 1983Q1 1983Q2 1983Q3 1983Q4 1984Q1 1984Q2 1984Q3 1984Q4 GDP 2650.1 2643.9 2705.3 2832.9 2953.5 2993.0 3079.6 3096.3 3092.9 3146.2 3164.2 3195.1 3254.9 3367.1 3450.9 3547.3 3666.9 3754.6 3818.2 3869.1 Quarter 1985Q1 1985Q2 1985Q3 1985Q4 1986Q1 1986Q2 1986Q3 198604 1987Q1 1987Q2 1987Q3 1987Q4 1988Q1 1988Q2 1988Q3 1988Q4 1989Q1 1989Q2 1989Q3 1989Q4 GDP 3940.0 3997.5 4076.9 4140.5 4215.7 4232.0 4290.2 4336.6 4408.3 4494.9 4573.5 4683.0 4752.4 4857.2 4947.3 5044.6 5139.9 5218.5 5277.3 5340.4 (a) Determine the trend of the series by applying linear regression for curve fitting (b) Evaluate whether there are any seasonal effects in this time series by creating a new quarterly variable as the independent variable of a linear regression. (c) Combine the trend and seasonal variables that you have used in (a) and (b) to construct a joint linear regression model for the GDP. Comment on whether the findings regarding the trend and seasonal effects in (a) and (b) are still relevant in this joint effect model. Below are the quarterly gross domestic product (GDP) data of country X from 1980 to 1989. Create a SAS Studio dataset/SAS Forecast Studio project for the analytics tasks below. Quarter 1980Q1 1980Q2 1980Q3 1980Q4 1981Q1 1981Q2 1981Q3 1981Q4 1982Q1 1982Q2 1982Q3 1982Q4 1983Q1 1983Q2 1983Q3 1983Q4 1984Q1 1984Q2 1984Q3 1984Q4 GDP 2650.1 2643.9 2705.3 2832.9 2953.5 2993.0 3079.6 3096.3 3092.9 3146.2 3164.2 3195.1 3254.9 3367.1 3450.9 3547.3 3666.9 3754.6 3818.2 3869.1 Quarter 1985Q1 1985Q2 1985Q3 1985Q4 1986Q1 1986Q2 1986Q3 198604 1987Q1 1987Q2 1987Q3 1987Q4 1988Q1 1988Q2 1988Q3 1988Q4 1989Q1 1989Q2 1989Q3 1989Q4 GDP 3940.0 3997.5 4076.9 4140.5 4215.7 4232.0 4290.2 4336.6 4408.3 4494.9 4573.5 4683.0 4752.4 4857.2 4947.3 5044.6 5139.9 5218.5 5277.3 5340.4 (a) Determine the trend of the series by applying linear regression for curve fitting (b) Evaluate whether there are any seasonal effects in this time series by creating a new quarterly variable as the independent variable of a linear regression. (c) Combine the trend and seasonal variables that you have used in (a) and (b) to construct a joint linear regression model for the GDP. Comment on whether the findings regarding the trend and seasonal effects in (a) and (b) are still relevant in this joint effect model.
Expert Answer:
Answer rating: 100% (QA)
Determine the trend of the series by applying linear regression for curve fitting Year Quarter GDP 1... View the full answer
Related Book For
Financial Reporting Financial Statement Analysis and Valuation a strategic perspective
ISBN: 978-1337614689
9th edition
Authors: James M. Wahlen, Stephen P. Baginski, Mark Bradshaw
Posted Date:
Students also viewed these accounting questions
-
We have studied a number of financial crises that have occurred over the past thirty years. The Mexican peso (1994), Asian Financial (1997-98), Russian (1998), Brazilian (2000), Argentina (2001),...
-
Are the following data time series? If not, explain why. a) Reports from the Bureau of Labor Statistics on the number of U.S. adults who are employed full time in each major sector of the economy. b)...
-
Are the following data time series? If not, explain why. a) Reports from the Bureau of Labor Statistics on the number of U.S. adults who are employed full- time in each major sector of the economy....
-
Bloomberg Intelligence listed 50 companies to watch in 2018 (www .bloomberg.com/features/companies-to-watch-2018). Twelve of the companies are listed here with their total assets and 12-month sales....
-
What is a budget decrement?
-
How many moles of F atoms are in a 75.0 mL sample of halothane (d = 1.871 g/mL)?
-
In 1951, DuPont began using the chemical perfluorooctanoic acid to manufacture Teflon. Due to the dangerous nature of the chemical, DuPont was given special instructions by its supplier to dispose of...
-
On May 1, 2012, Bovar Company began the manufacture of a new paging machine known as Dandy. The company installed a standard costing system to account for manufacturing costs. The standard costs for...
-
a. Write a story problem for the expression 6 x b. Find the value of the expression. Show or explain your work. da f
-
Draw a normal curve and identify the approximate location of the following scores. (a) You have the most frequent score. (b) You have a low-frequency score, but the score is higher than most. (c) You...
-
2. A financial adviser has a new client and is helping him to diversify his stock portfolio. He is considering 4 stocks for purchase and the table below shows the dividend paid per share. Stock A...
-
Outline the Early Years Learning Framework (EYLF) principles and the Learning Outcomes that reflect a commitment to inclusion.
-
What are the ways in which racism might affect your view of bullfighting
-
Most organizations of varying sizes tend to emphasize market-competitive pay systems . What do you believe is most important for a company's competitive advantage with people by way of compensation...
-
Discuss the usage of Internet and Artificial Intelligence (AI) during each stage of Recruitment and Selection process.
-
Can you describe one business such as company growth, cost management, competitive environment which important to the company?
-
The average monthly temperatures for Boulder, Colorado, from January 1991 to September2008 are given in Boulder.xlsx.a. Plot the time series, create seasonal plot for the last four years of the...
-
The baseball player A hits the ball from a height of 3.36 ft with an initial velocity of 34.8 ft/s. 0.14 seconds after the ball is hit, player B who is standing 15 ft away from home plate begins to...
-
The text discusses inputs managers might use to determine fair values of assets and liabilities and identifies different classifications of assets identified in SFAS No. 157. Suppose a major...
-
The chapter asserts that dividends are value-relevant even though the firms dividend policy is irrelevant. How can that be true? What is the key assumption in the theory of dividend policy...
-
Exhibit 3.25 presents common-size statements of cash flows for eight firms in various industries. All amounts in the common-size statements of cash flows are expressed as a percentage of cash flow...
-
Prove (20.20), i.e. show that \(\mathbb{E}\left[B_{T}^{2 n} e^{-B_{T}^{2}} ight]=\frac{(2 n-1) ! !}{\sqrt{2 T+1}}\left(\frac{T}{2 T+1} ight)^{n}\). Here, \((-1) ! !:=1\), \((2 n-1) ! !=1 \cdot 3...
-
Show that the definition of the iterated It integral for \(f \in L^{2}\left(\mathbb{R}_{+}^{2} ight)\) (Definition 20.9) is independent of the approximating sequence. Data From 20.9 Definition 20.9...
-
Verify the claim made in Example 21.9 using Its formula. Derive from the proof of Lemma 21.8 explicitly the form of the transformation and the coefficients in Example 21.9. Integrate the condition...
Study smarter with the SolutionInn App