

Question: Below are the ratios (with excel formulas) calculated for Pepsi-Co, Inc. for you - all you need to do is calculate the Coca-Cola Company ratios
| Below are the ratios (with excel formulas) calculated for Pepsi-Co, Inc. for you - all you need to do is calculate the Coca-Cola Company ratios | |||||||
| Pepsi-Co, Inc. | The Coca-Cola Company | ||||||
| Selected Financial Data | Selected Financial Data | ||||||
| For years ended December 31 | For years ended December 31 | ||||||
| 2020 | 2019 | 2018 | 2020 | 2019 | 2018 | ||
| Acid-test ratio (CA-inventory-prepaid)/CL | 0.77 | 0.66 | 0.82 | ||||
| Current ratio | 0.98 | 0.86 | 0.99 | ||||
| Debt ratio | 0.85 | 0.81 | 0.81 | ||||
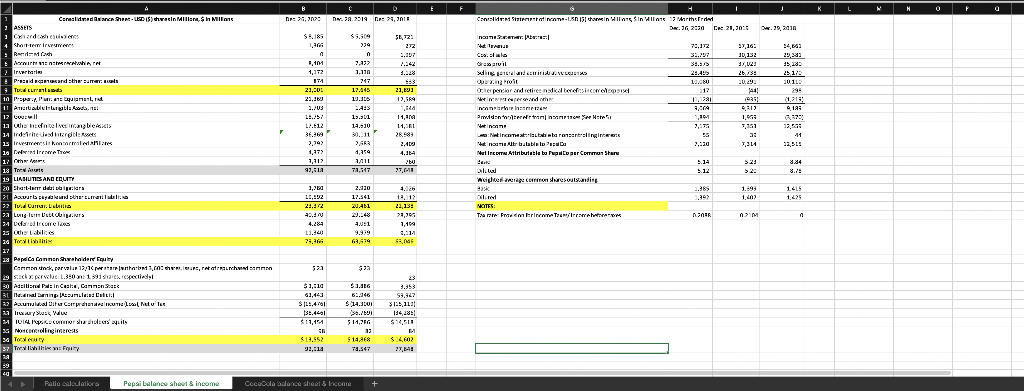
| Earnings per share | 5.14 | 5.23 | 8.84 | ||||
| Inventory turnover | 8.47 | 9.32 | 9.39 | ||||
| Net income ($ in millions) | $ 7,120 | $ 7,314 | $ 12,515 | ||||
| Rate of return on assets | 10.97% | 13.05% | 13.40% | ||||
| Receivables turnover | 8.67 | 8.98 | 9.05 | ||||
| Return on assets | 9.34% | 10.31% | 17.69% | ||||
| Operating income percentage | 14.32% | 15.32% | 15.64% | ||||
| Revenues ($ in millions) | $ 70,372 | $ 67,161 | $ 64,661 | ||||
| Times interest earned ratio | 9.04 | 10.96 | 8.54 | ||||
| Working capital ($ in millions) | (371) | (2,816) | (245) | ||||
| Notes: | |||||||
| Debt ratio = TL/TA | |||||||
| Inv. TO= CGS/Avg. Inv. | |||||||
| Rate of Return on Assets=EBIT/TA | |||||||
| Acciounts receivable TO=SALES/Avg. AR | |||||||
| Return on Assets=NI + {Interest Expense * (1-Tax)} / Avg TA | |||||||
| Operating Income %=operatinig income /SALES REVENUE | |||||||
| TIE Ratio=EBIT/Interest Exp. | |||||||
| WC=CA - CL | |||||||
| Inventory Turnover, Receivables Turnover, Return on Assets figures for 2018 use ONLY 2018 values in the denominator as we don't have 2017 numbers to average | |||||||
| Requirements | |||||||
| 1. Using the financial data for the three years for The Coca-Cola Company discuss the company's: | |||||||
| a. Ability to pay current liabilities; | |||||||
| b. Ability to sell inventory and collect receivables; | |||||||
| c. Ability to pay long-term debt; and | |||||||
| d. Profitability. | |||||||
| 2. Using the financial data for the three years for PepsiCo, Inc., discuss the company's | |||||||
| a. Ability to pay current liabilities; | |||||||
| b. Ability to sell inventory and collect receivables; | |||||||
| c. Ability to pay long-term debt; and | |||||||
| d. Profitability. | |||||||
| 3. Compare Coca-Colas financial position to PepsiCos financial position throughout the three | |||||||
| years given. How do the two companies compare in the following areas? | |||||||
| a. Ability to pay current liabilities; | |||||||
| b. Ability to sell inventory and collect receivables; | |||||||
| c. Ability to pay long-term debt; and | |||||||
| d. Profitability. | |||||||
| 4. What conclusions can you draw from your analysis of the two companies? Which company do | |||||||
| you think is in a stronger financial position? | |||||||
GUESE ' RECRET WILDE SEG UE '12*2*
Step by Step Solution
There are 3 Steps involved in it
1 Expert Approved Answer
Step: 1 Unlock

Question Has Been Solved by an Expert!
Get step-by-step solutions from verified subject matter experts
Step: 2 Unlock
Step: 3 Unlock