

Question: D E G M N o P Q R S U V W Below are the ratios (with excel formulas) calculated for Pepsi-Co, Inc. for
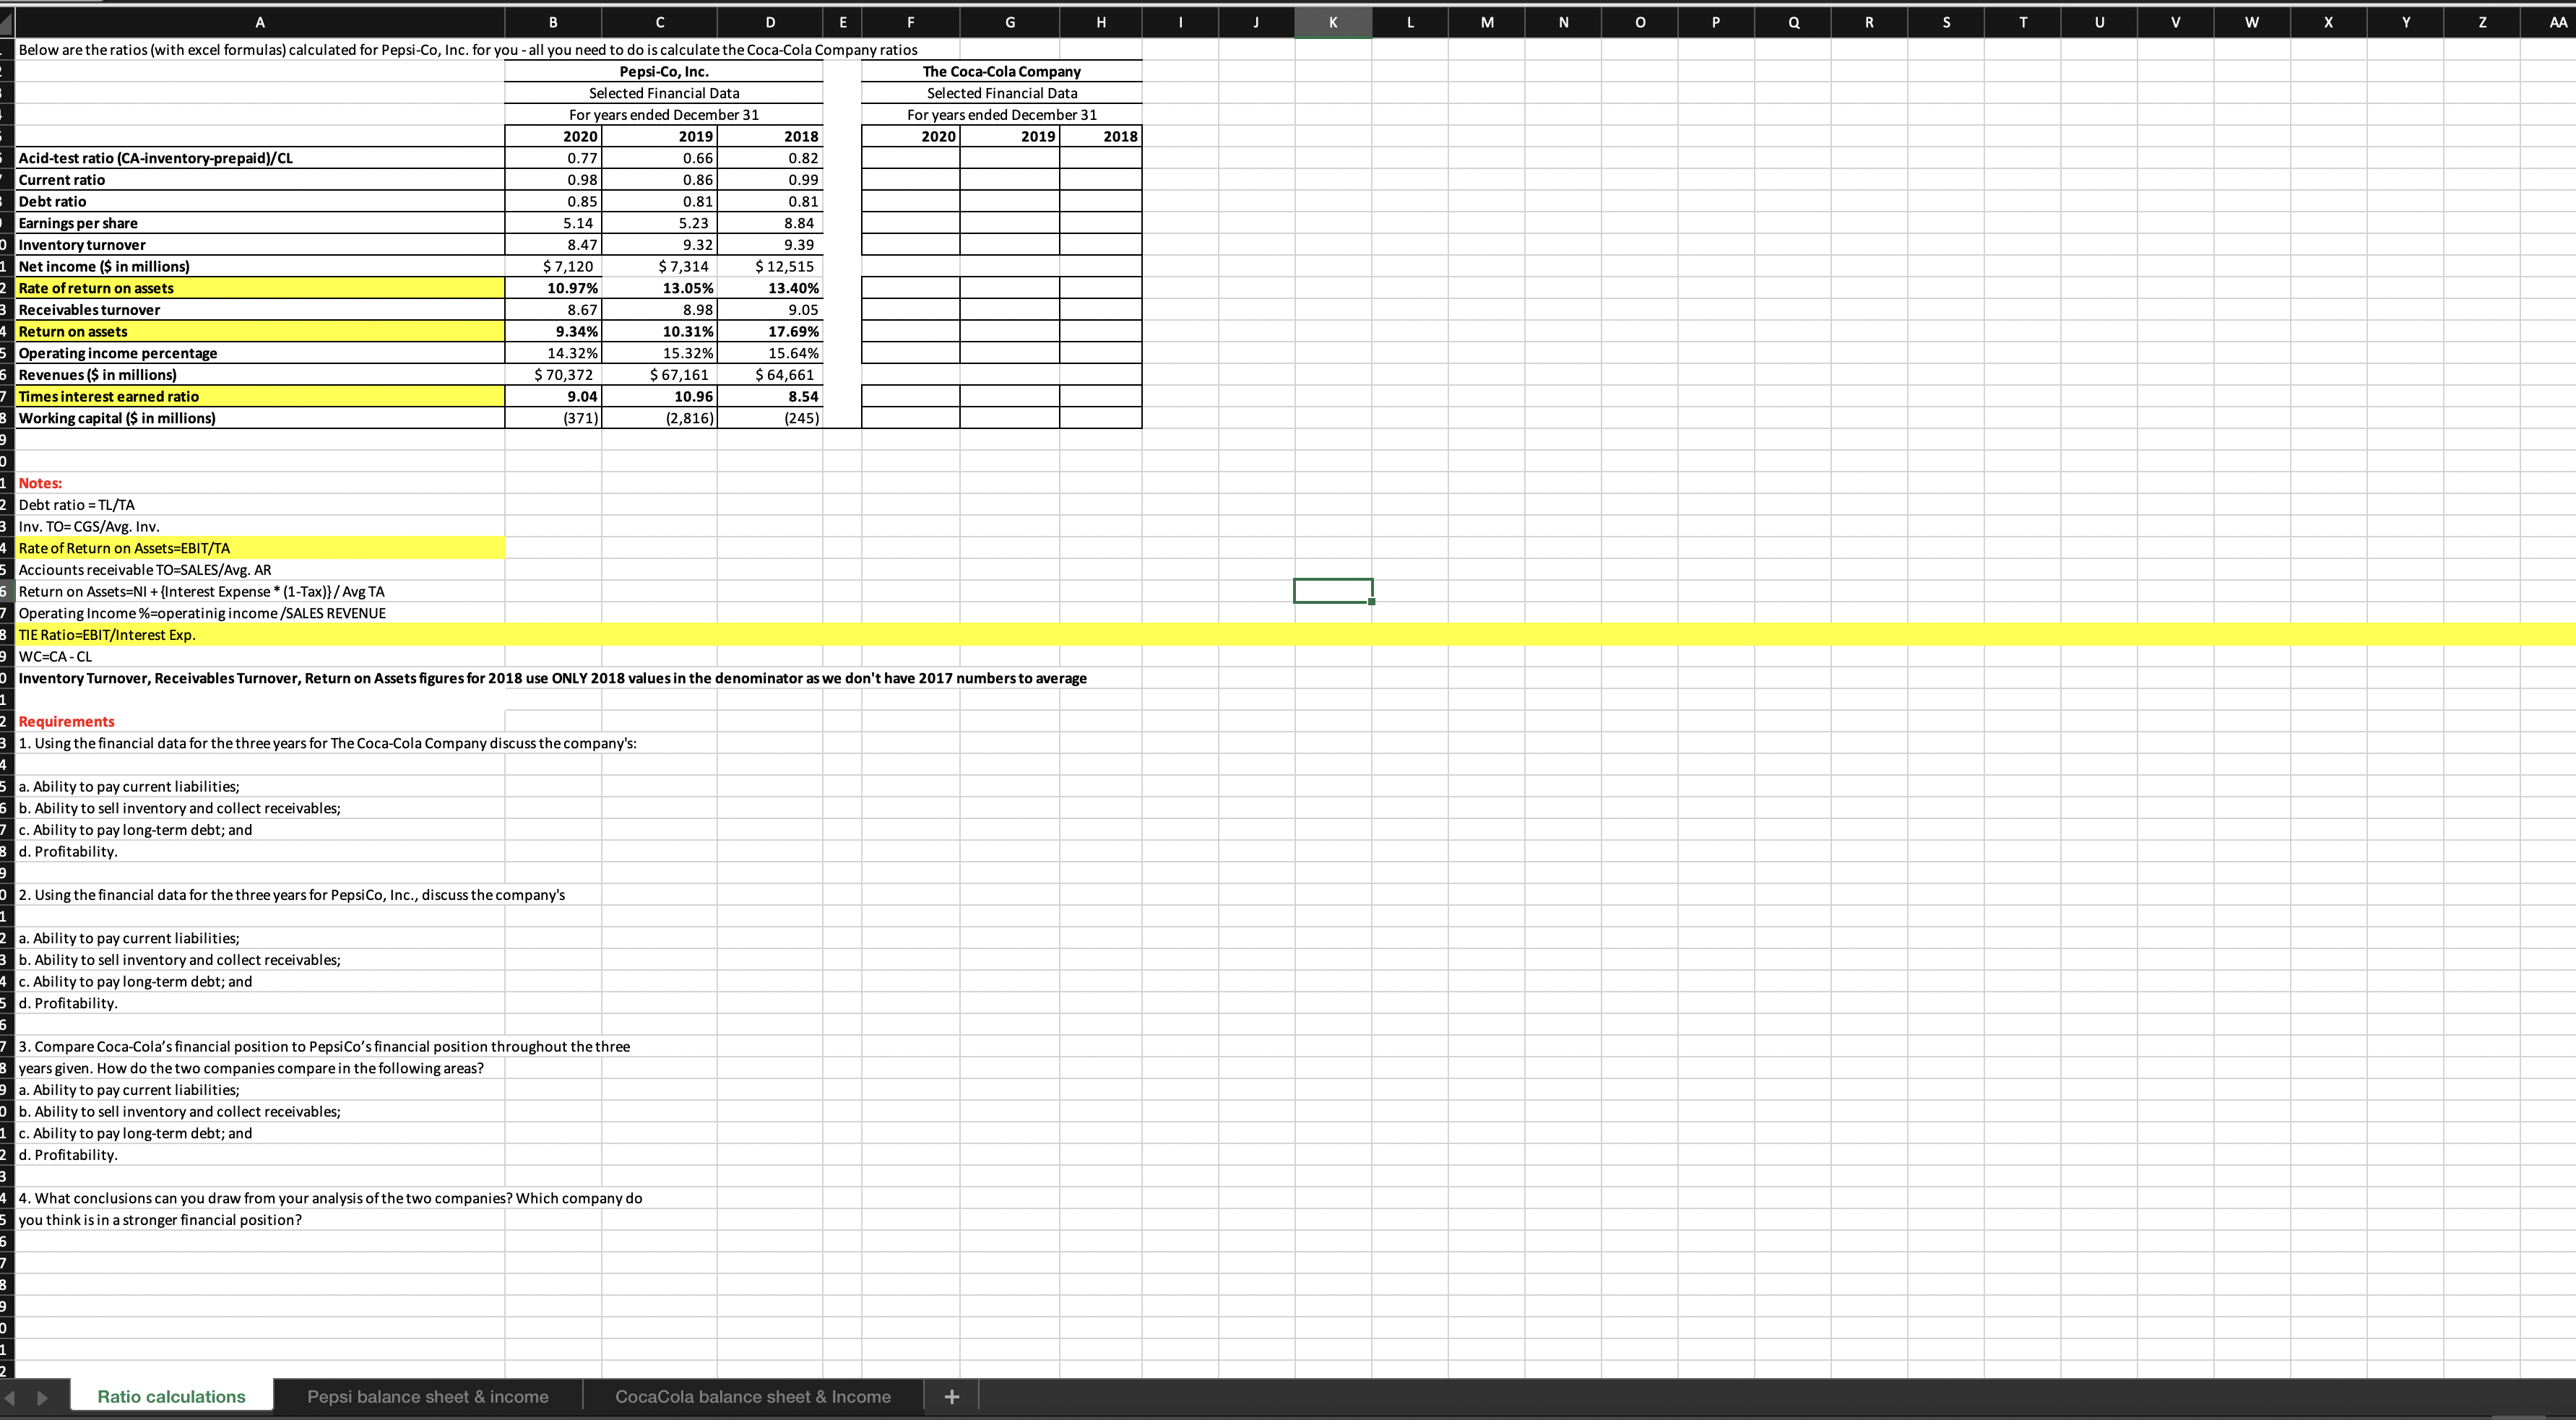
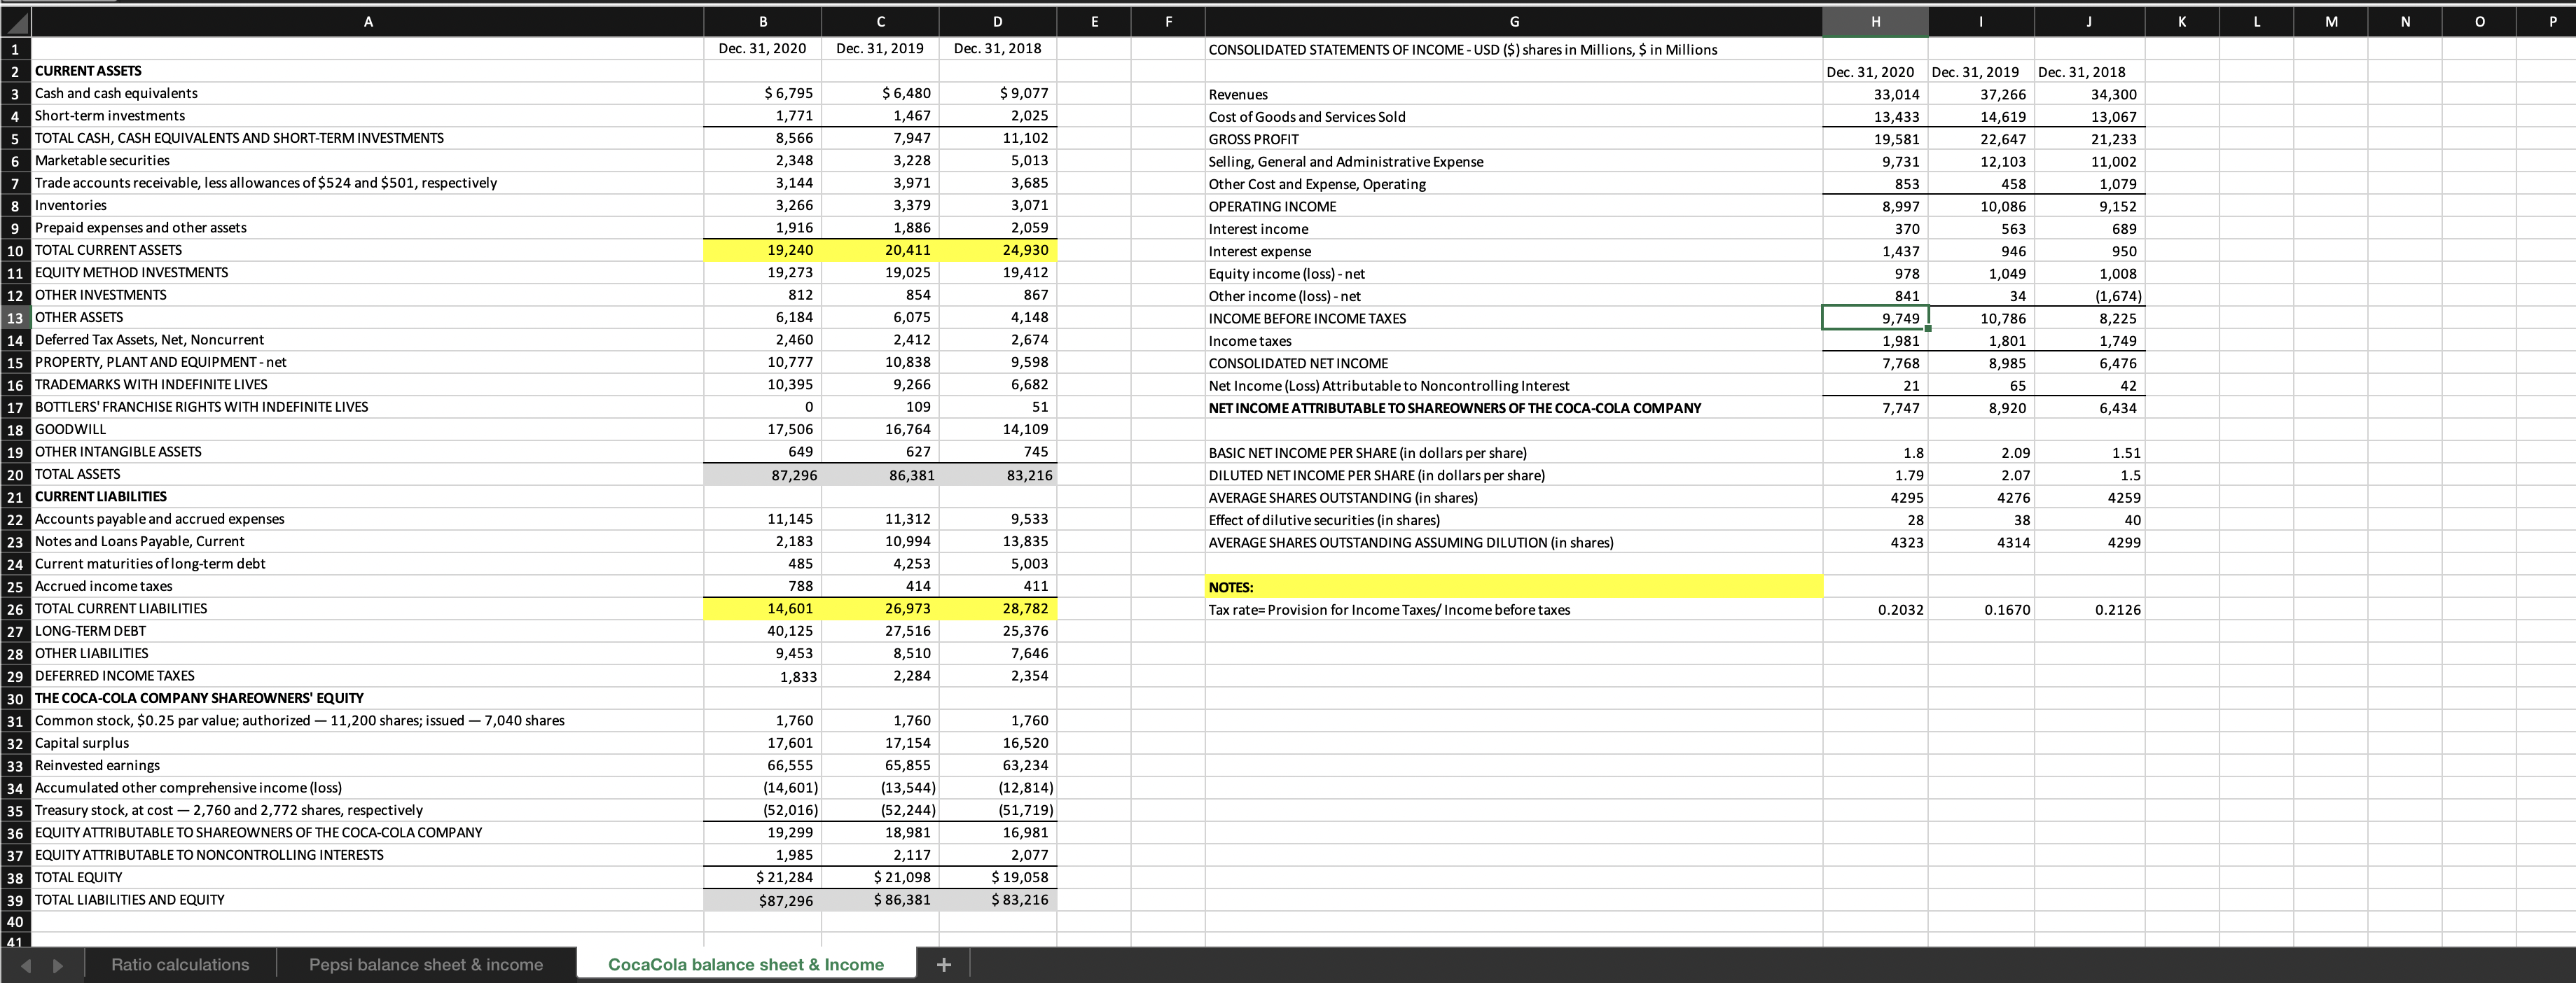
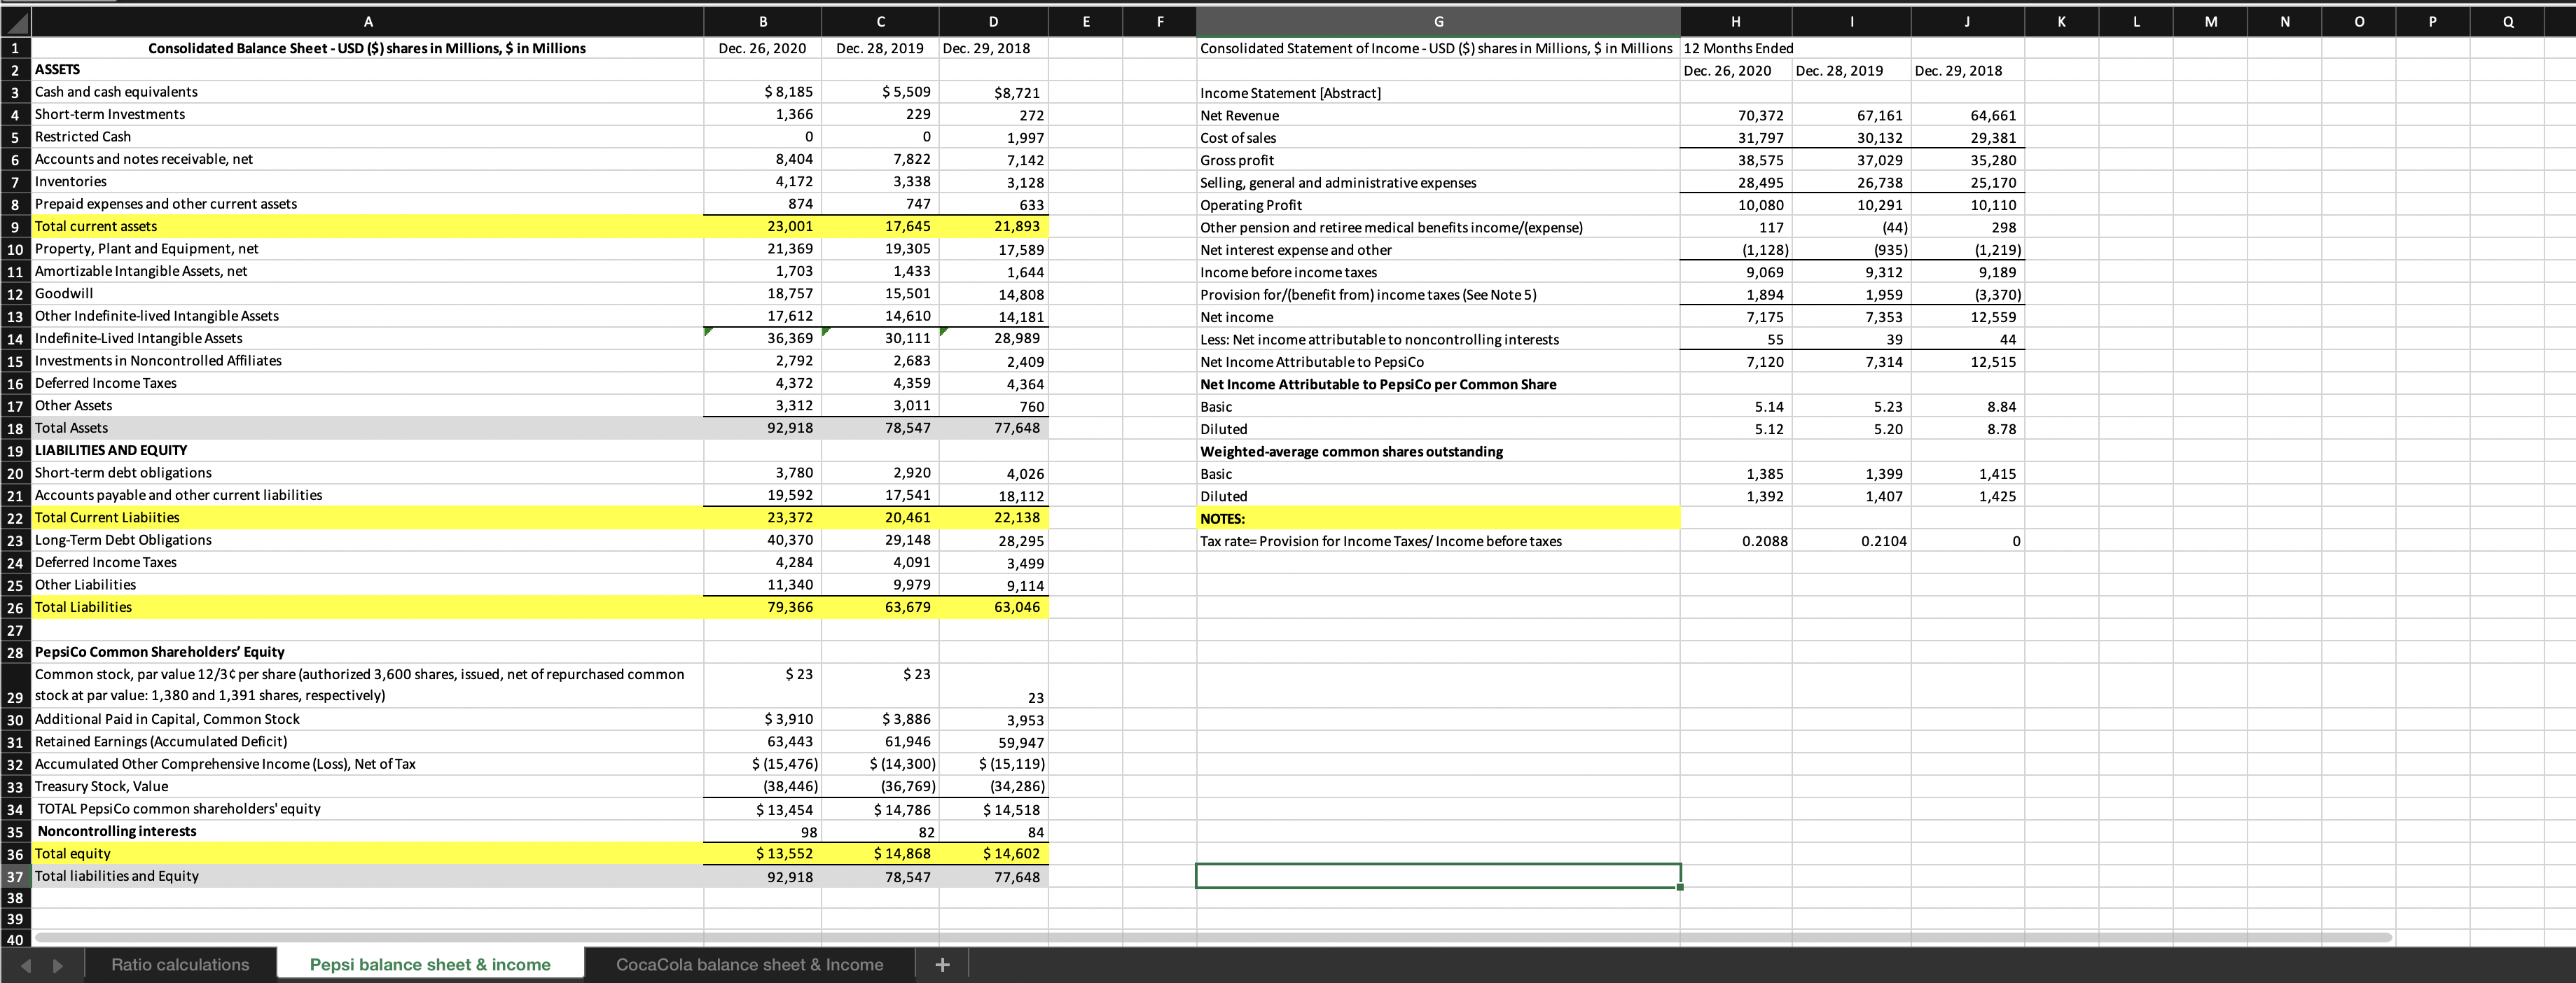
D E G M N o P Q R S U V W Below are the ratios (with excel formulas) calculated for Pepsi-Co, Inc. for you - all you need to do is calculate the Coca-cola Company ratios Pepsi-Co, Inc. The Coca-Cola Company Selected Financial Data Selected Financial Data For years ended December 31 For years ended December 31 2020 2019 2018 2020 2019 2018 Acid-test ratio (CA-inventory-prepaid)/CL 0.77 0.66 0.82 Current ratio 0.98 0.86 0.99 Debt ratio 0.85 0.81 0.81 Earnings per share 5.14 5.23 8.84 Inventory turnover 8.4 9.32 9.39 Net income ($ in millions) 7,120 $7,314 $ 12,515 Rate of return on assets 10.97% 13.05% 13.40% Receivables turnover 8.67 8.98 9.05 Return on assets .34% 10.31% 7.69% Operating income percentage 14.32% 15.32% 15.64% Revenues ($ in millions) 70,372 67,161 $ 64,661 Times interest earned ratio 9.04 10.96 8.54 Working capital ($ in millions) 371) (2,816) (245) Notes: Debt ratio = TL/TA Inv. TO=CGS/Avg. Inv. Rate of Return on Assets=EBIT/TA Acciounts receivable TO=SALES/Avg. AR Return on Assets=NI + {Interest Expense * (1-Tax)} / Avg TA Operating Income %=operating income /SALES REVENUE TIE Ratio=EBIT/Interest Exp WC=CA - CL Inventory Turnover, Receivables Turnover, Return on Assets figures for 2018 use ONLY 2018 values in the denominator as we don't have 2017 numbers to average Requirements 1. Using the financial data for the three years for The Coca-cola Company discuss the company's: a. Ability to pay current liabilities; b. Ability to sell inventory and collect receivables; c. Ability to pay long-term debt; and d. Profitability. 2. Using the financial data for the three years for PepsiCo, Inc., discuss the company's a. Ability to pay current liabilities; b. Ability to sell inventory and collect receivables; c. Ability to pay long-term debt; and d. Profitability. 3. Compare Coca-cola's financial position to PepsiCo's financial position throughout the three years given. How do the two companies compare in the following areas? a. Ability to pay current liabilities; b. Ability to sell inventory and collect receivables; c. Ability to pay long-term debt; and d. Profitability. 4. What conclusions can you draw from your analysis of the two companies? Which company do you think is in a stronger financial position? Ratio calculations Pepsi balance sheet & income CocaCola balance sheet & Income +D E G L M N o P Dec. 31, 2020 Dec. 31, 2019 Dec. 31, 2018 CONSOLIDATED STATEMENTS OF INCOME - USD ($) shares in Millions, $ in Millions CURRENT ASSETS Dec. 31, 2020 Dec. 31, 2019 Dec. 31, 2018 Cash and cash equivalents $ 6,795 $ 6,480 $9,077 Revenues 33,014 37,266 34,300 Short-term investments 1,771 1,467 2,025 Cost of Goods and Services Sold 13,433 14,619 13,067 TOTAL CASH, CASH EQUIVALENTS AND SHORT-TERM INVESTMENTS 3,566 7,947 11,102 GROSS PROFIT 19,581 22,647 21,233 Marketable securities 2,348 3,228 5,013 Selling, General and Administrative Expense 9,731 12,103 11,002 Trade accounts receivable, less allowances of $524 and $501, respectively 3,144 3,971 3,685 Other Cost and 853 458 1,079 8 Inventories 3,266 3,379 3,071 OPERATING INCOME 3,997 10,086 9.152 Prepaid expenses and other assets 1,916 1,886 2,059 Interest income 370 563 689 10 TOTAL CURRENT ASSETS 19,240 20,411 24,930 Interest expense 1,437 946 950 11 EQUITY METHOD INVESTMENTS 19 ,273 19,025 19,412 Equity income (loss) - net 978 1,049 1,008 12 OTHER INVESTMENTS 812 854 867 Other income (loss) - net 841 34 (1,674) 13 OTHER ASSETS 6,184 6,075 4,148 INCOME BEFORE INCOME TAXES 9,749 10,786 8,225 14 Deferred Tax Assets, Net, Noncurrent 2,460 2,412 2,674 Income taxe 1,981 1,801 1,749 PROPERTY, PLANT AND EQUIPMENT - net 10,777 10,838 9,598 CONSOLIDATED NET INCOME 7,768 3,985 5,476 TRADEMARKS WITH INDEFINITE LIVES 10,395 9,266 6,682 Net Income (Loss) Attributable to Noncontrolling Interest 21 65 42 BOTTLERS' FRANCHISE RIGHTS WITH INDEFINITE LIVES 109 51 NET INCOME ATTRIBUTABLE TO SHAREOWNERS OF THE COCA-COLA COMPANY 7,747 6,434 GOODWILL 17,506 16,764 14,109 19 OTHER INTANGIBLE ASSETS 649 627 745 BASIC NET INCOME PER SHARE (in dollars per share) 1.8 2.09 1.51 20 TOTAL ASSETS 87,296 86,381 83,216 DILUTED NET INCOME PER SHARE (in dollars per share) 1.79 2.07 1.5 CURRENT LIABILITIES AVERAGE SHARES OUTSTANDING (in shares 4295 4276 4259 Accounts payable and accrued expenses 11,145 11,312 9,533 Effect of dilutive securities (in shares 28 38 40 Notes and Loans Payable, Current 2,183 10,994 13,835 AVERAGE SHARES OUTSTANDING ASSUMING DILUTION (in shares) 4323 4314 4299 24 Current maturities of long-term debt 485 4,253 5,003 Accrued income taxes 788 41 411 NOTES: TOTAL CURRENT LIABILITIES 14,601 26,973 28,782 Tax rate= Provision for Income Taxes/ Income before taxes 0.2032 0.1670 0.2126 27 LONG-TERM DEBT 40,12 27,516 25,376 OTHER LIABILITIES 9,453 8,510 7,646 29 DEFERRED INCOME TAXES 1,833 2,284 2,354 30 THE COCA-COLA COMPANY SHAREOWNERS' EQUITY Common stock, $0.25 par value; authorized - 11,200 shares; issued - 7,040 shares 1,760 1,760 1,760 Capital surplus 17,601 17,154 6,520 Reinvested earnings 66,555 65,855 63 ,234 Accumulated other comprehensive income (loss) (14,601 (13,544) 12,814) Treasury stock, at cost - 2,760 and 2,772 shares, respectively 52,016) (52,244) 51,719) 36 EQUITY ATTRIBUTABLE TO SHAREOWNERS OF THE COCA-COLA COMPANY 19,299 18,981 6,981 37 EQUITY ATTRIBUTABLE TO NONCONTROLLING INTERESTS 1,985 2,117 2,077 38 TOTAL EQUITY 21,284 $ 21,098 $ 19,058 39 TOTAL LIABILITIES AND EQUITY $87,296 $ 86,381 $ 83,216 40 41 Ratio calculations Pepsi balance sheet & income CocaCola balance sheet & Income +E F G L M N P Q Consolidated Balance Sheet - USD ($) shares in Millions, $ in Millions Dec. 26, 2020 Dec. 28, 2019 Dec. 29, 2018 Consolidated Statement of Income - USD ($) shares in Millions, $ in Millions 12 Months Ended ASSET Dec. 26, 2020 Dec. 28, 2019 Dec. 29, 2018 Cash and cash equivalents $ 8,18 $ 5,509 $8,721 Income Statement [Abstract] Short-term Investments 1,366 229 272 Net Revenue 70,372 67,161 54,661 Restricted Cash 1,997 Cost of sales 31,797 30,13 29,381 Accounts and notes receivable, net 8,404 7,822 7,142 Gross profit 38,575 37,029 35,280 Inventories 1,172 3,338 3,128 Selling, general and administrative expenses 28,495 26,73 25,170 Prepaid expenses and other current assets 874 747 633 Operating Profit 10,080 10,291 10.110 Total current assets 23,001 17,645 21,893 Other pension and retiree medical benefits income/(expense) 117 (44) 298 10 Property, Plant and Equipment, net 21,369 19,305 7,589 Net interest expense and other 1,128 (935) (1,219) Amortizable Intangible Assets, net 1,703 1,433 1,644 Income before income taxes 9,069 9,312 9 ,189 12 Goodwill 18,757 15,50 14,808 Provision for/(benefit from) income taxes (See Note 5) 1,894 1,959 (3,370) 13 Other Indefinite-lived Intangible Assets 17,61 14,610 14,181 Net income 7,175 7,353 12,559 Indefinite-Lived Intangible Assets 36,369 30,111 28,989 Less: Net income attributable to noncontrolling interests 55 39 44 15 Investments in Noncontrolled Affiliates 2,79 2,683 2,409 Net Income Attributable to PepsiCo 7,120 7,314 12,515 16 Deferred Income Taxes 4,372 4,359 4,364 Net Income Attributable to PepsiCo per Common Share 17 Other Assets 3,312 3,01 760 Basic 5.14 5.23 8.84 18 Total Assets 92,918 78,547 17,648 Diluted 5.12 5.20 8.78 19 LIABILITIES AND EQUITY Weighted-average common shares outstanding 20 Short-term debt obligations 3,780 2,920 4,026 Basic 1,385 1,399 1,415 21 Accounts payable and other current liabilities 19,59 17,541 18,112 Diluted 1,392 1,407 1,425 22 Total Current Liabiities 23,372 20,461 22,138 NOTES: Long-Term Debt Obligations 40,370 29,148 28,295 Tax rate= Provision for Income Taxes/ Income before taxes 0.2088 0.2104 24 Deferred Income Taxes 4,284 4.091 3,499 Other Liabilities 11,340 9,979 9,114 Total Liabilities 79,36 63,679 63,046 28 PepsiCo Common Shareholders' Equity Common stock, par value 12/3c per share (authorized 3,600 shares, issued, net of repurchased common $ 23 $ 23 29 stock at par value: 1,380 and 1,391 shares, respectively) 23 30 Additional Paid in Capital, Common Stock $ 3,91 $ 3,886 3,953 Retained Earnings (Accumulated Deficit) 63,44 61,946 59,947 Accumulated Other Comprehensive Income (Loss), Net of Tax $ (15,476) $ (14,300) $ (15,119) 33 Treasury Stock, Value (38,446 (36, 769) (34,286) 34 TOTAL PepsiCo common shareholders' equity 13,454 $ 14,786 $ 14,518 Noncontrolling interests 98 82 84 36 Total equity $ 13,552 $ 14,868 $14,602 37 Total liabilities and Equity 92,918 78,547 77,648 38 39 40 Ratio calculations Pepsi balance sheet & income CocaCola balance sheet & Income +
Step by Step Solution
There are 3 Steps involved in it

Get step-by-step solutions from verified subject matter experts