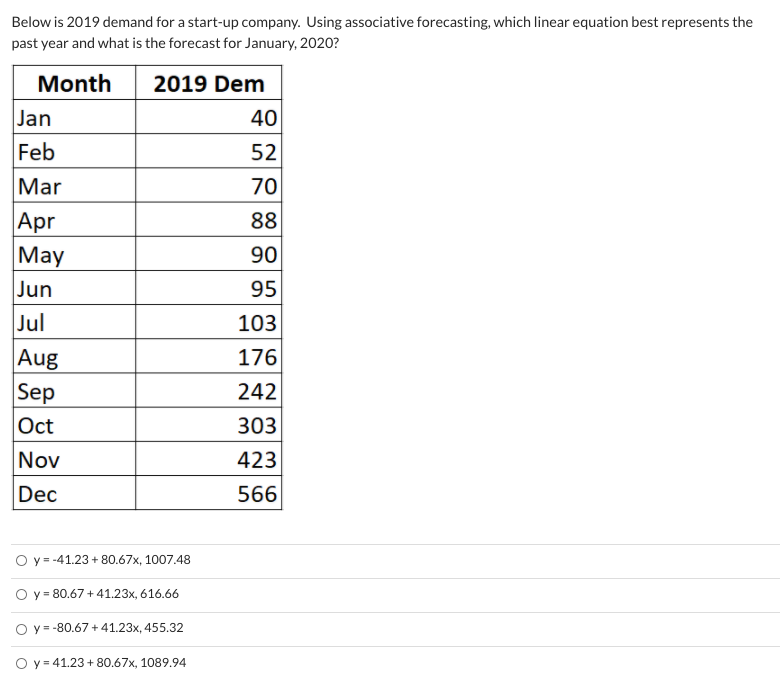
Question: Below is 2019 demand for a start-up company. Using associative forecasting, which linear equation best represents the past year and what is the forecast for

Below is 2019 demand for a start-up company.

Below is 2019 demand for a start-up company. Using associative forecasting, which linear equation best represents the past year and what is the forecast for January, 2020? Month Jan Feb 2019 Dem 40 52 70 88 90 95 Mar Apr May Jun Jul Aug Sep Oct Nov 103 176 242 303 423 566 Dec O y = -41.23 + 80.67x, 1007.48 O y = 80.67 +41.23x, 616.66 O y=-80.67 +41.23x, 455.32 O y = 41.23 + 80.67x, 1089.94

Step by Step Solution

There are 3 Steps involved in it

1 Expert Approved Answer
Step: 1 Unlock blur-text-image
Question Has Been Solved by an Expert!

Get step-by-step solutions from verified subject matter experts

Step: 2 Unlock
Step: 3 Unlock

Students Have Also Explored These Related General Management Questions!