

Question: Below is a Bland Altman Plot that examines the agreement between an our new Body Composition App (%Fat3C-IMAGE) and the Laboratory Criterion (%Fat4C-UWW). The average
Below is a Bland Altman Plot that examines the agreement between an our new Body Composition App (%Fat3C-IMAGE) and the Laboratory Criterion (%Fat4C-UWW). The average of the 2 measures is plotted on the X axis. The difference between the two measures is plotted on the Y axis.
What percentage of the variance in Constant Error can be explained by the Mean of the two measures? Asked another way, the Error is correlated with the Mean, what percentage of the error can be explained by this correlation?
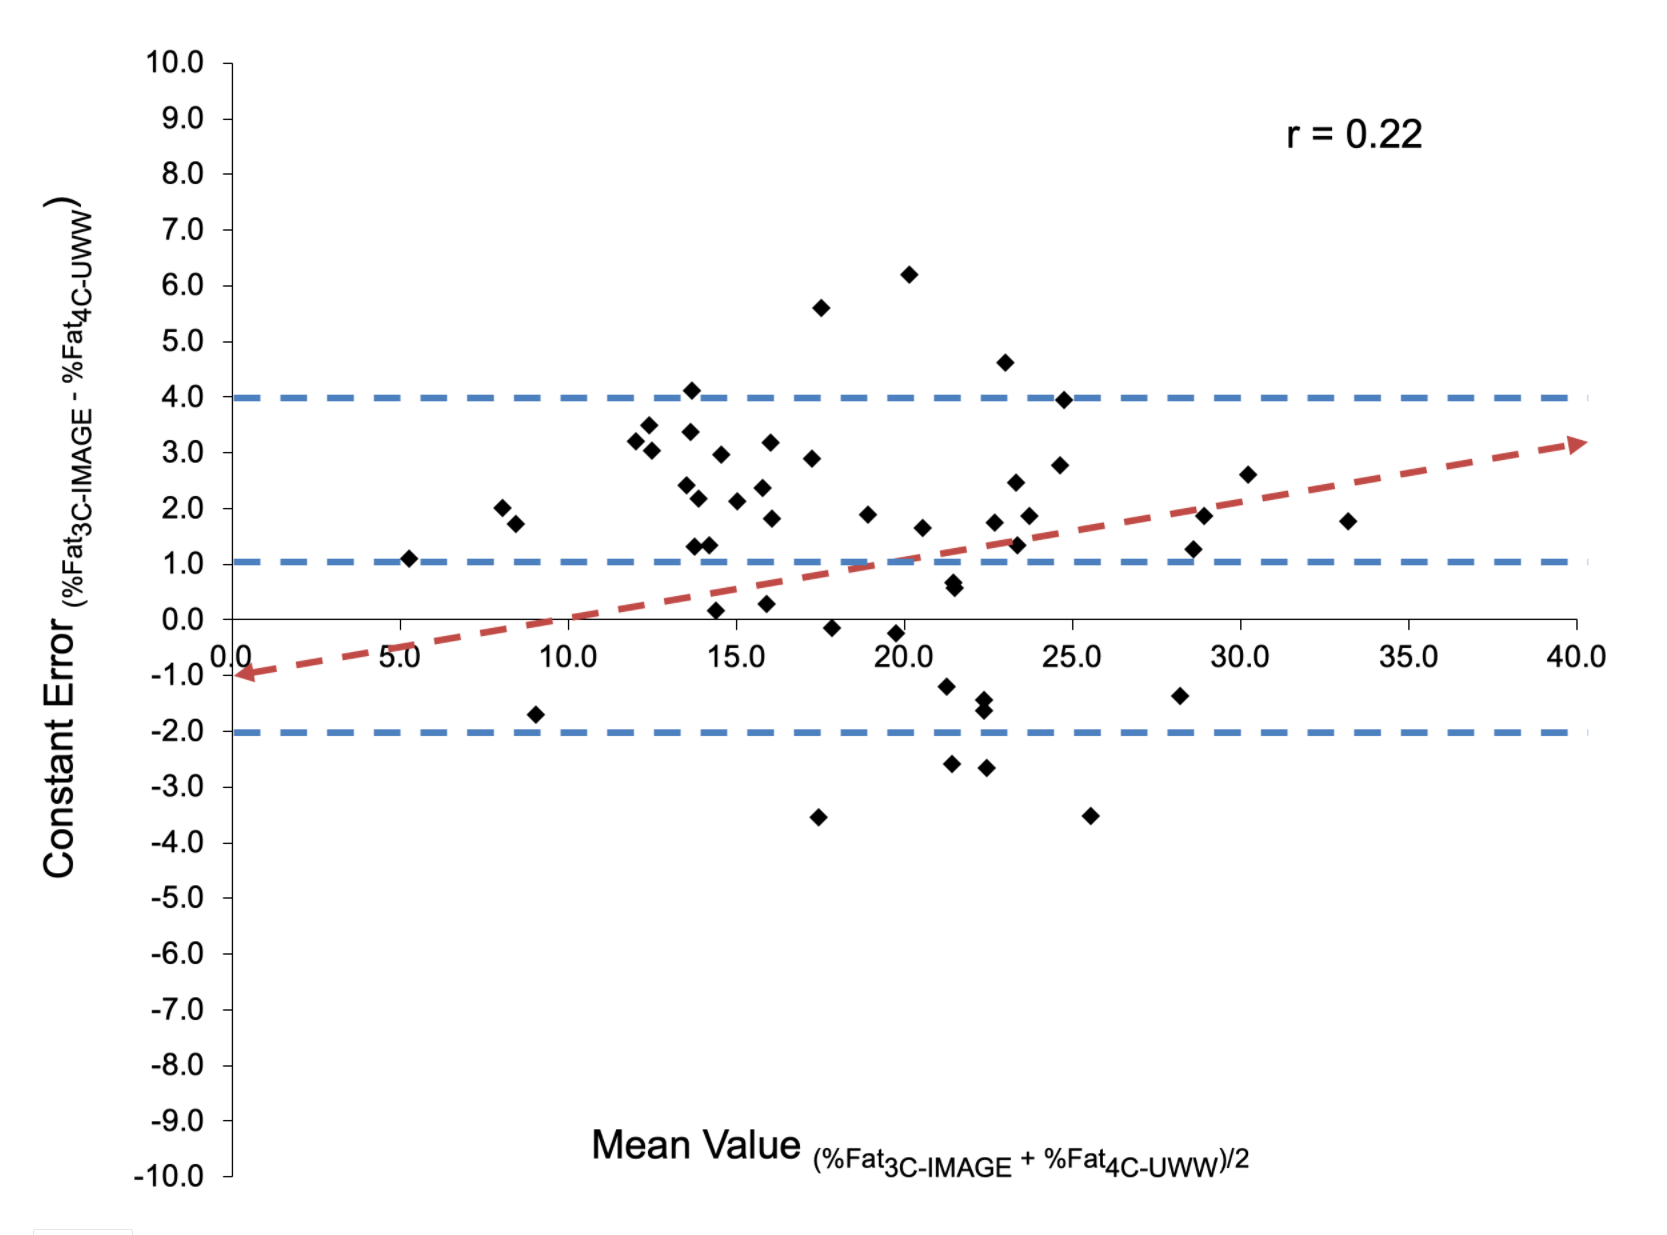
10.0 9.0 r = 0.22 8.0 7.0 6.0 5.0 4.0 3.0 2.0 Constant Error (%Fat3C-IMAGE - %Fat4C-UWW 1.0 0.0 -1.0 09- - 5.0 10.0 15.0 20.0 25.0 30.0 35.0 40.0 -2.0 -3.0 -4.0 -5.0 -6.0 -7.0 -8.0 -9.0 -10.0 Mean Value (%Fat3C-IMAGE + %Fat4C-UWW)/2
Step by Step Solution
There are 3 Steps involved in it

Get step-by-step solutions from verified subject matter experts