

Question: f. . . Bland Altman Plot Scout Test 1 vs Test 2 4.0 3.0 O 2.0 1.4 O 1. O ULUA Difference of Scouttests O


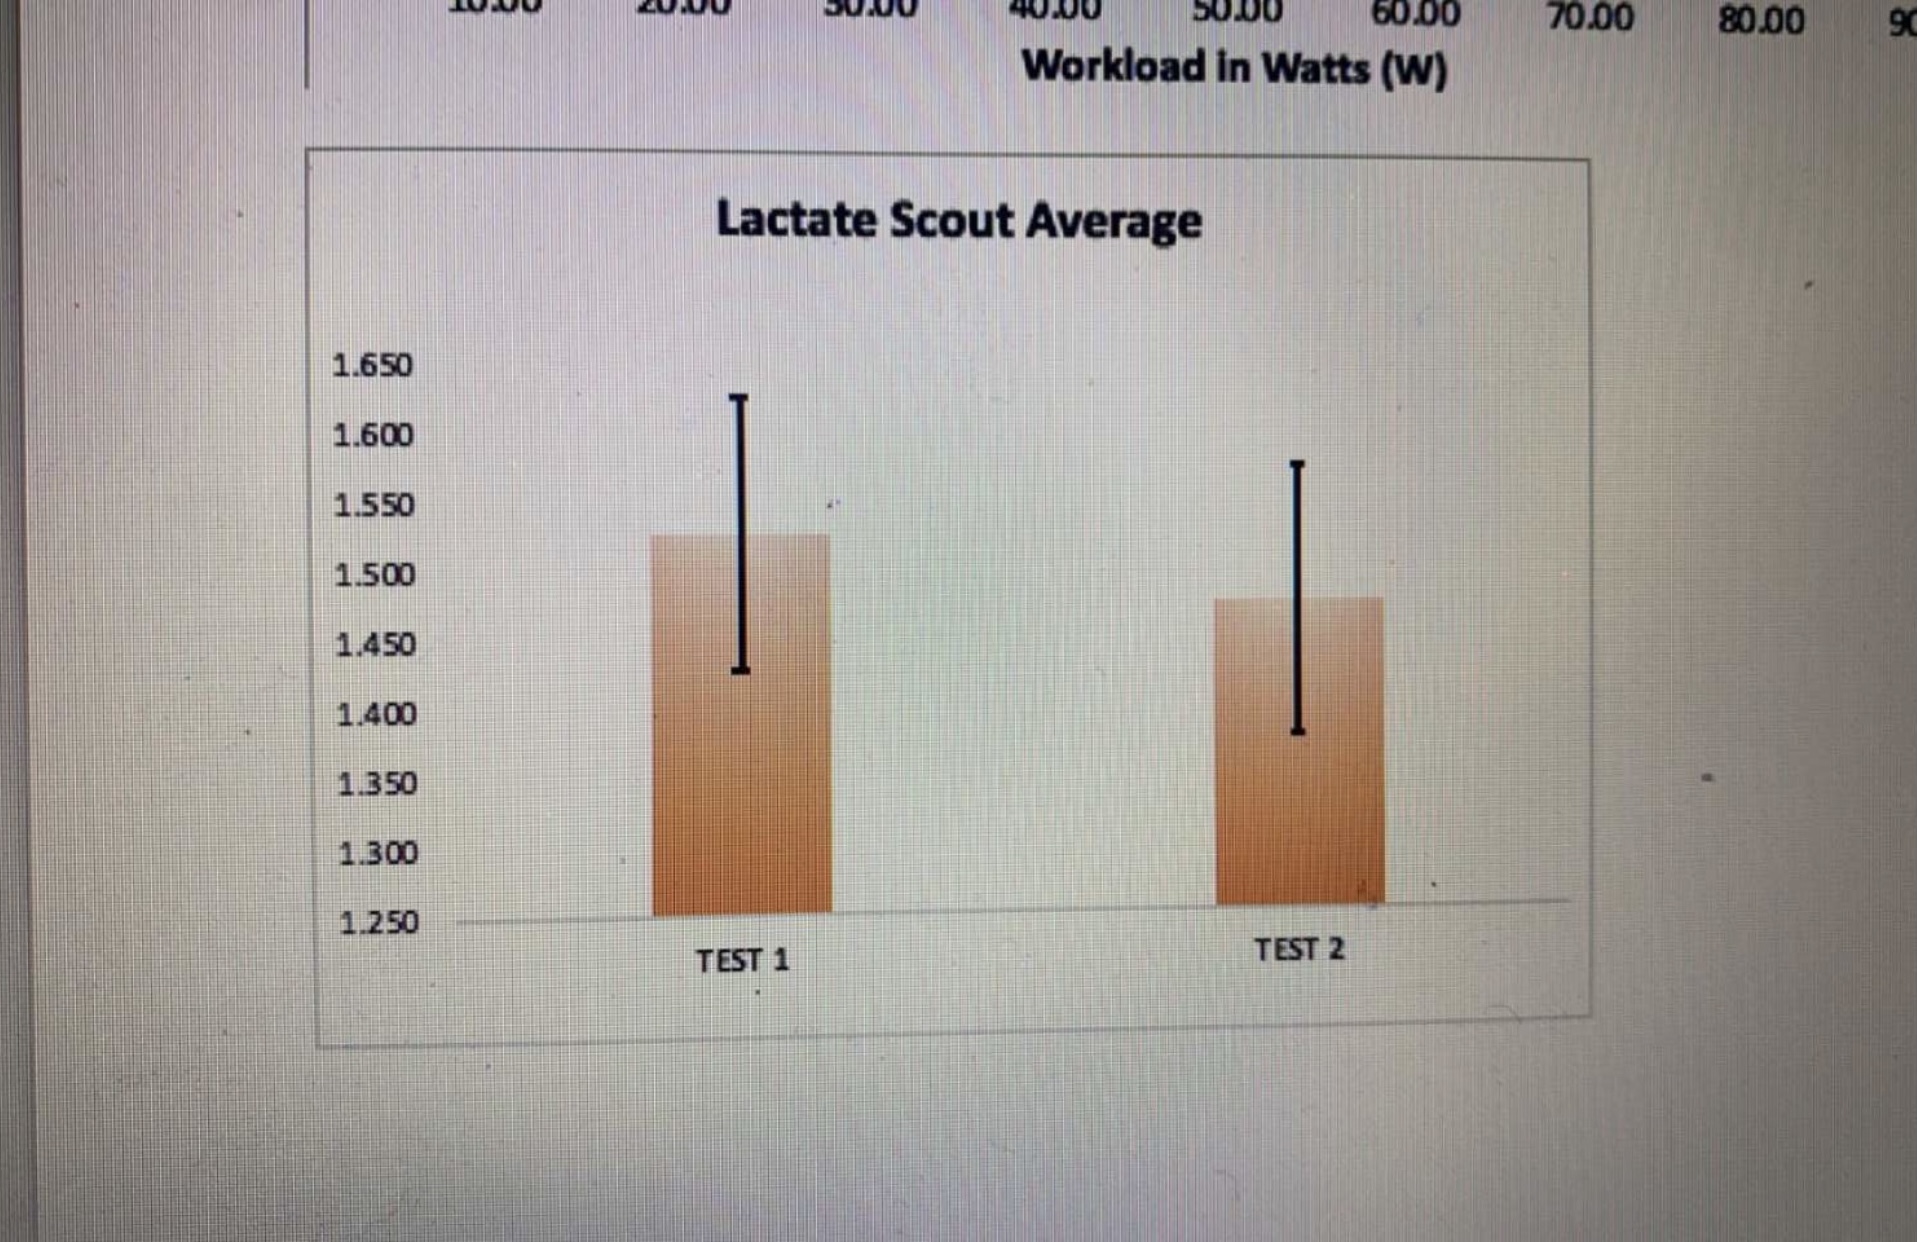
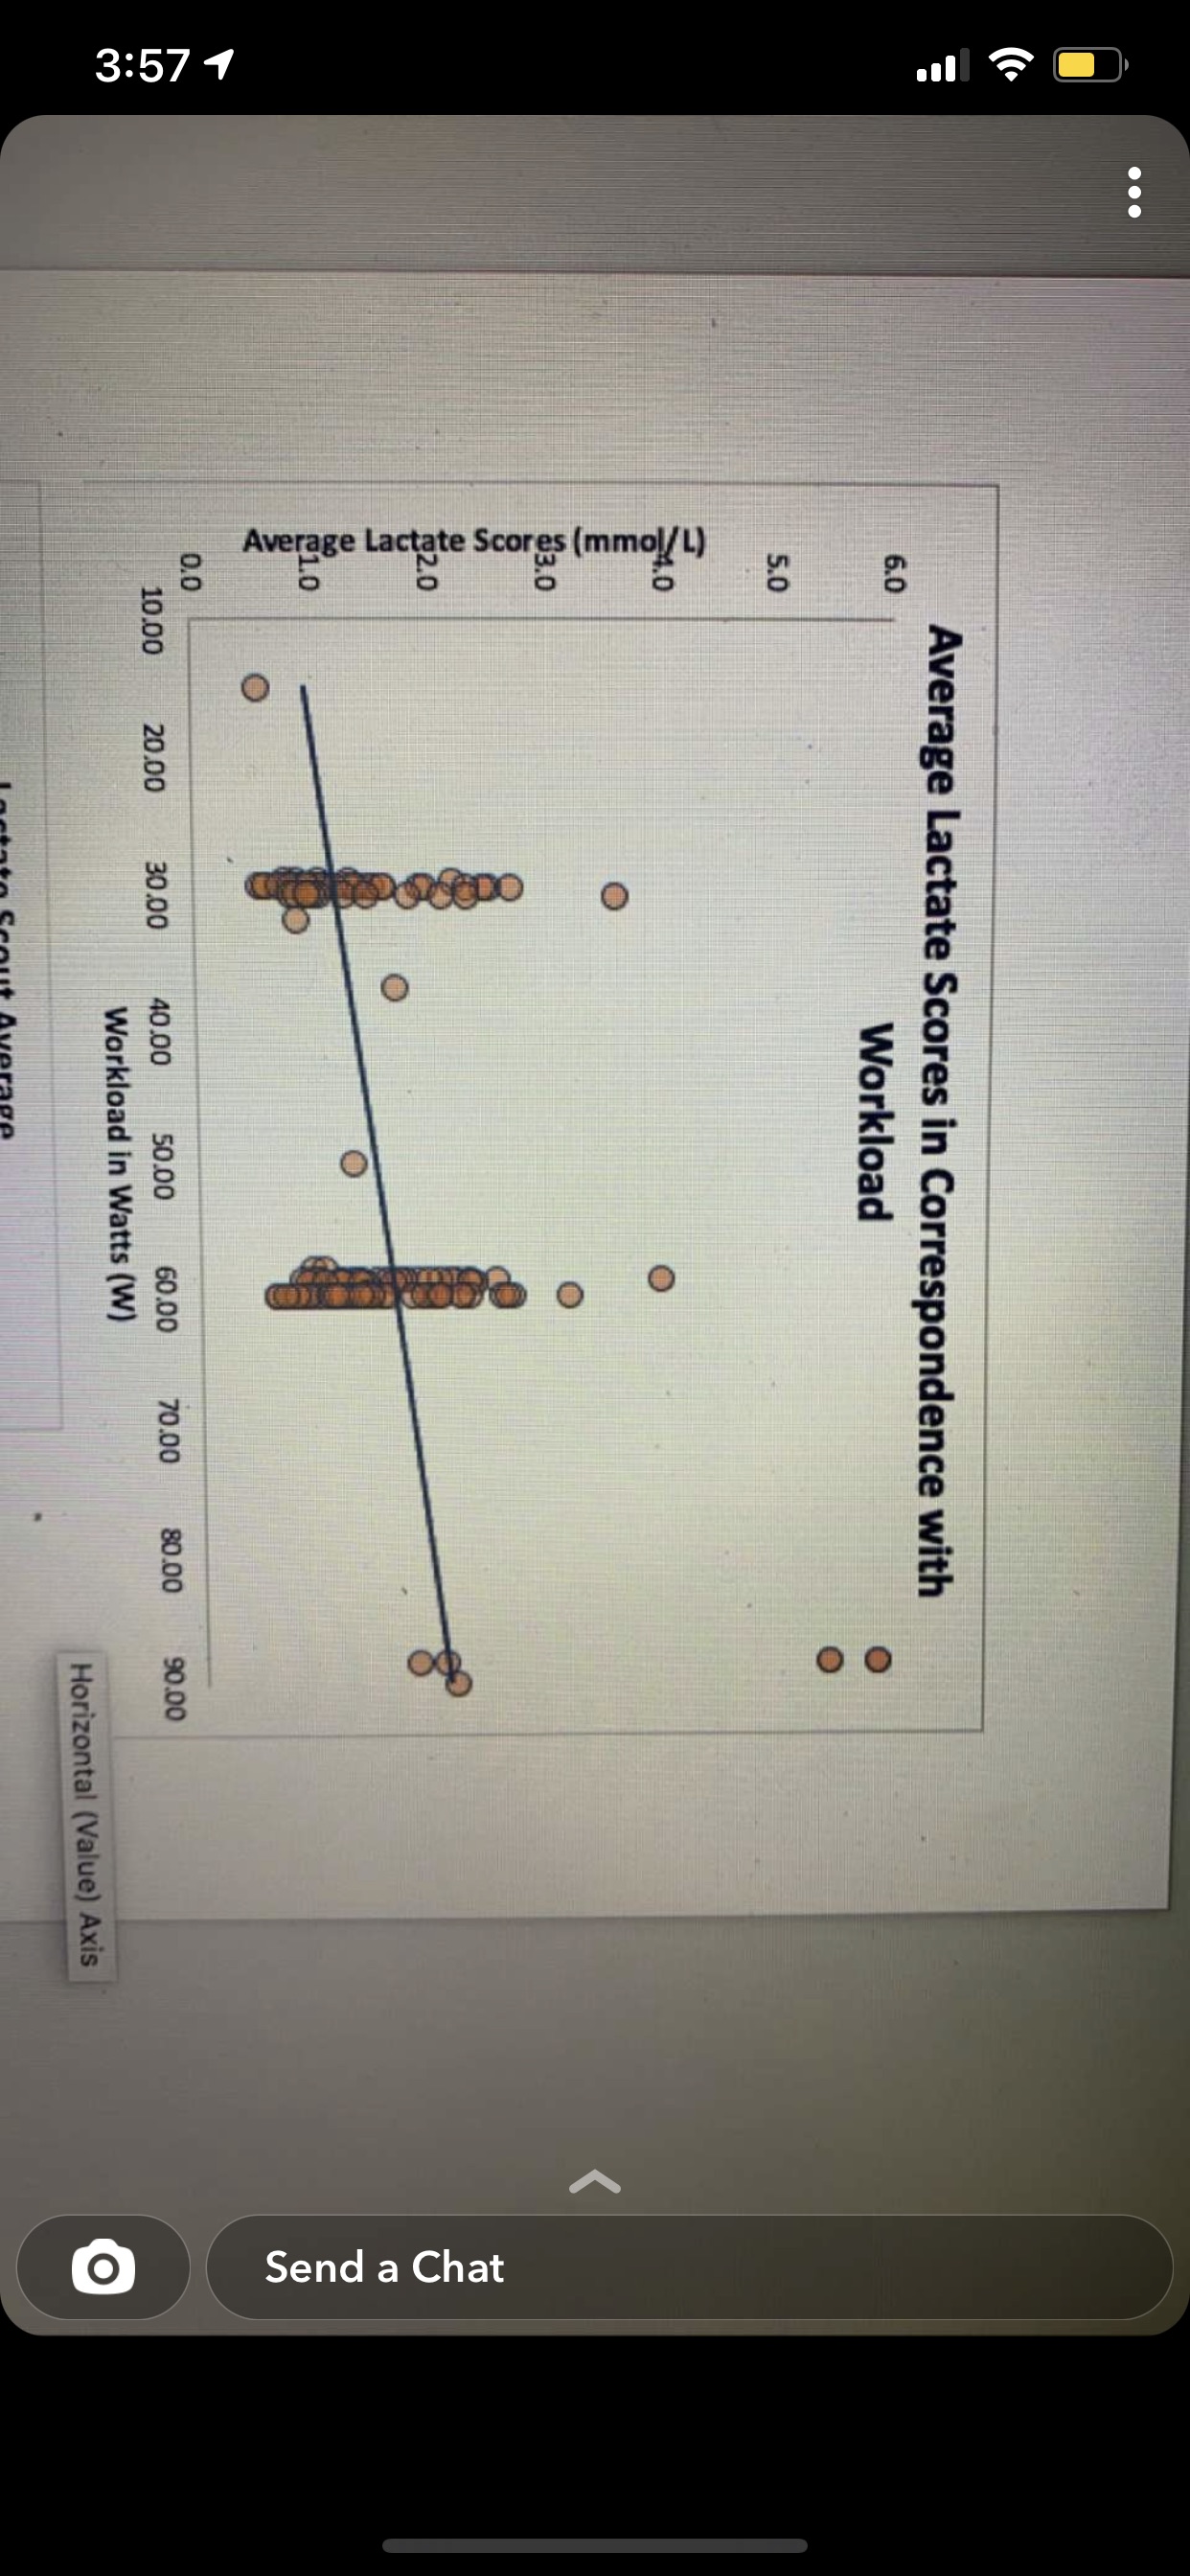
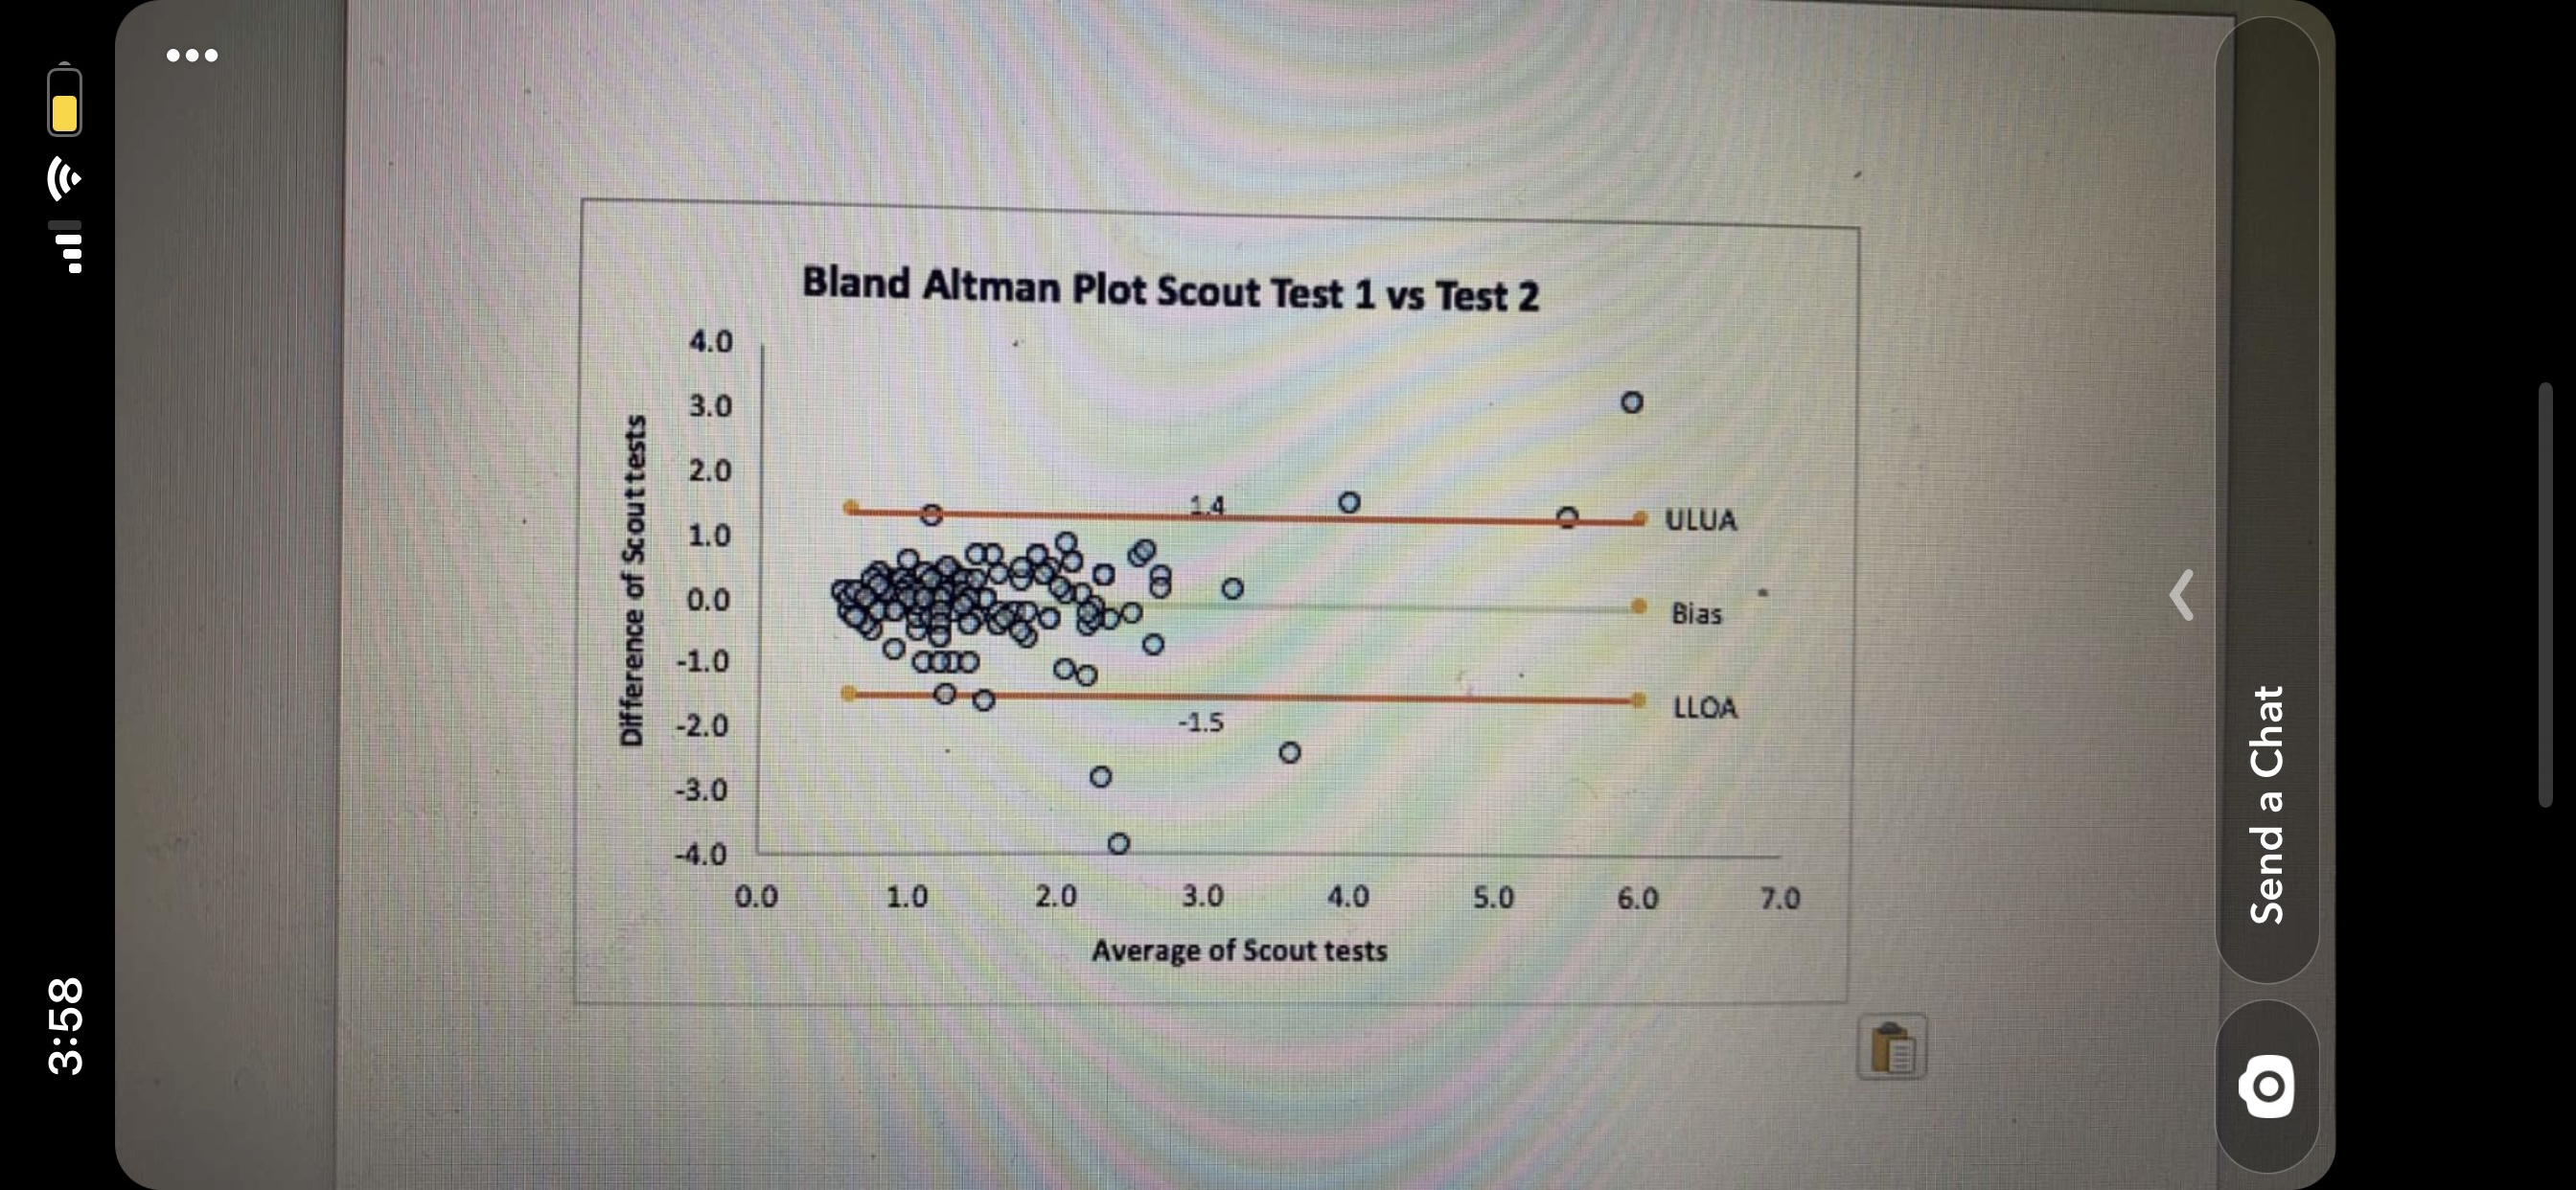

\f. . . Bland Altman Plot Scout Test 1 vs Test 2 4.0 3.0 O 2.0 1.4 O 1. O ULUA Difference of Scouttests O 0. 8 O Bias 1.0 O OO -2.0 -1.5 LLOA O -3.0 O Send a Chat -4.0 O 0.0 1.0 2.0 3.0 4.0 5.0 6.0 7.0 Average of Scout tests 3:58 E O40.00 50.00 60.00 70.00 80.00 90 Workload in Watts (W) Lactate Scout Average 1.650 1.600 1.550 1.500 1.450 1.400 1.350 1.300 1.250 TEST 1 TEST 2
Step by Step Solution
There are 3 Steps involved in it
1 Expert Approved Answer
Step: 1 Unlock

Question Has Been Solved by an Expert!
Get step-by-step solutions from verified subject matter experts
Step: 2 Unlock
Step: 3 Unlock