

Question: Below is a chart with profit/loss on the vertical axis, and the $/ exchange rate on the horizontal axis. The solid line shows the profit/loss
Below is a chart with profit/loss on the vertical axis, and the $/ exchange rate on the horizontal axis. The solid line shows the profit/loss schedule for a:
Question 8 options:
| put option in isolation (e.g. used for speculating that the pound will depreciate) | |
| None of the above | |
| covered call option (a call option is used as a hedge) | |
| covered put option (a put option is used as a hedge) |
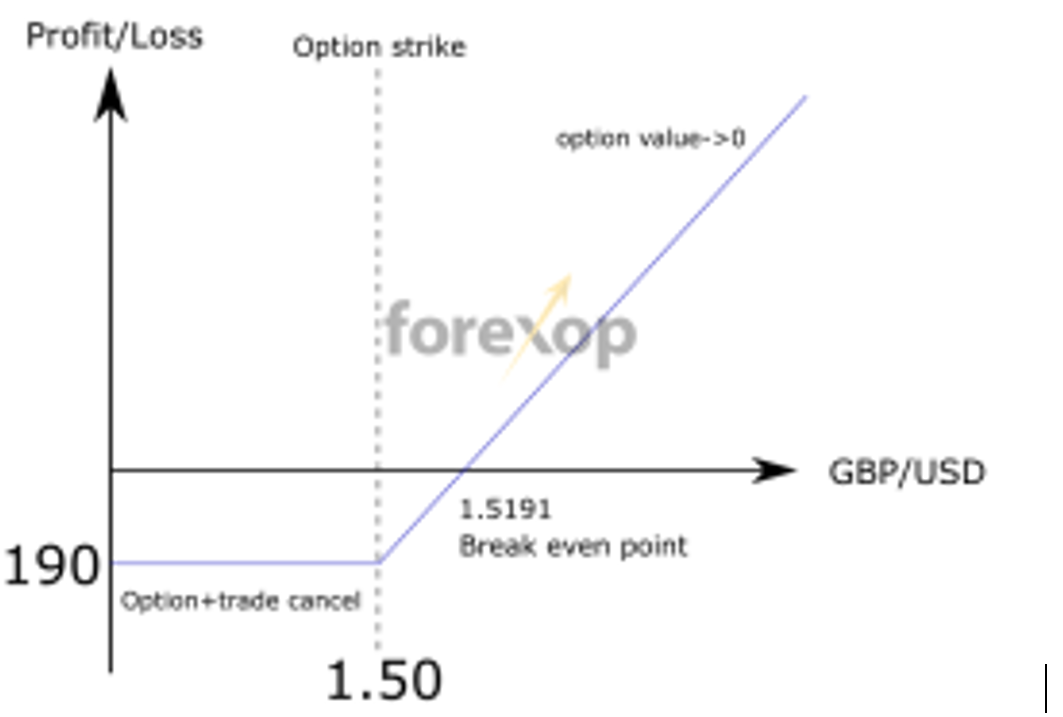
Profit/Loss Option strike option value->0 forekop GBP/USD 1.5191 Break even point 190 Option+trade cancel 1.50
Step by Step Solution
There are 3 Steps involved in it
1 Expert Approved Answer
Step: 1 Unlock

Question Has Been Solved by an Expert!
Get step-by-step solutions from verified subject matter experts
Step: 2 Unlock
Step: 3 Unlock