

Question: Below is a frequency table of the employmentvariable generated from the PewShop data. Describe what information each column of the table displays. What is the
Below is a frequency table of the employmentvariable generated from the PewShop data. Describe what information each column of the table displays. What is the difference between Percent and Valid Percent?
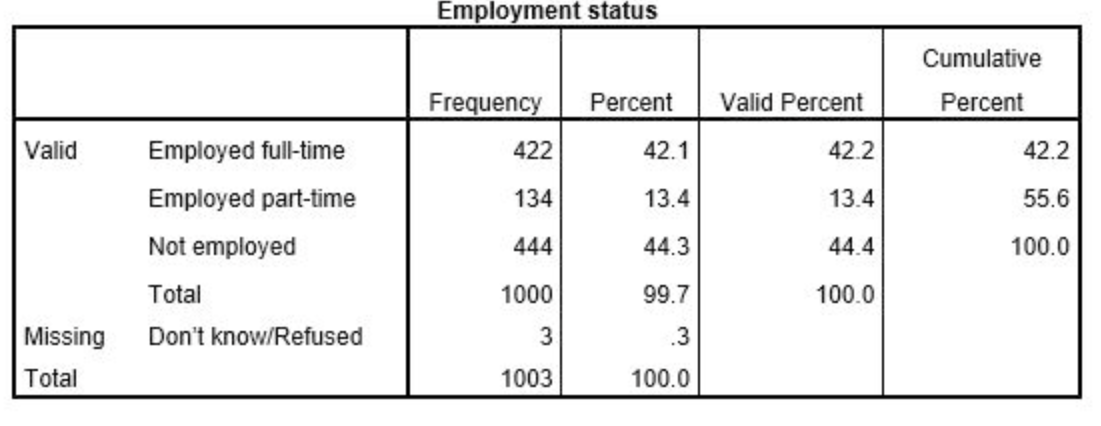
Employment status Cumulative Frequency Percent Valid Percent Percent Valid Employed full-time 422 42.1 42.2 42.2 Employed part-time 134 13.4 13.4 55.6 Not employed 444 44.3 44.4 100.0 Total 1000 99.7 100.0 Missing Don't know/Refused 3 .3 Total 1003 100.0
Step by Step Solution
There are 3 Steps involved in it
1 Expert Approved Answer
Step: 1 Unlock

Question Has Been Solved by an Expert!
Get step-by-step solutions from verified subject matter experts
Step: 2 Unlock
Step: 3 Unlock