

Question: Below is a Sn-Pb Phase Diagram: Composition (at % Sn) 60 20 40 80 100 327c T 600 300 Liquid Solidus 2 -Liquidus 500 Solidus
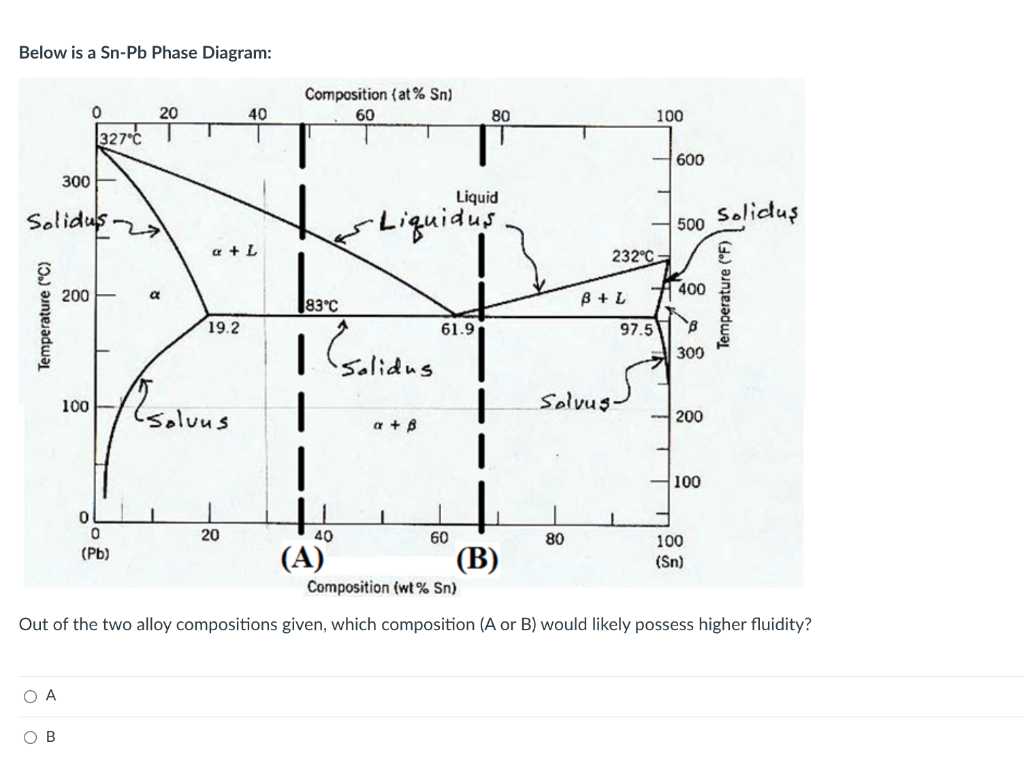
Below is a Sn-Pb Phase Diagram: Composition (at % Sn) 60 20 40 80 100 327c T 600 300 Liquid Solidus 2 -Liquidus 500 Solidus + L 232C 200 400 183C BUL Temperature (C) Temperature (F) 19.2 61.9 97.5 | B 300 Solidus 100 Msolvus Solvus | 200 a + B 100 0 40 80 20 60 100 (Pb) (A) (B) (Sn) Composition (wt% Sn) Out of the two alloy compositions given, which composition (A or B) would likely possess higher fluidity? OA OB A foundry will add to grey cast iron to create iron. O Manganese; Grey O Chromium; White O Manganese; Malleable Magnesium; Ductile Magnesium; Flake Angle or taper put into a casting design to help remove the pattern from the sand: Choke O Chaplet O Draft O Sleeve
Step by Step Solution
There are 3 Steps involved in it

Get step-by-step solutions from verified subject matter experts