

Between what values are the most extreme 17% of the data? Draw the box-and-whisker plot. Are there
Fantastic news! We've Found the answer you've been seeking!
Question:
Between what values are the most extreme 17% of the data? Draw the box-and-whisker plot. Are there outliers in your data? Why? Calculate two statistics for skewness and two for pointing, at your choice. Calculate the coefficients of standardized bias and standardized kurtosis. Interpret these values.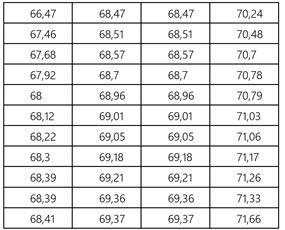
Expert Answer:

Related Book For 

Modeling the Dynamics of Life Calculus and Probability for Life Scientists
ISBN: 978-0840064189
3rd edition
Authors: Frederick R. Adler
Posted Date:
