

Question: Birth Year Use the following data to create a time series graph. You may draw the graph by hand or use technology. Be sure to
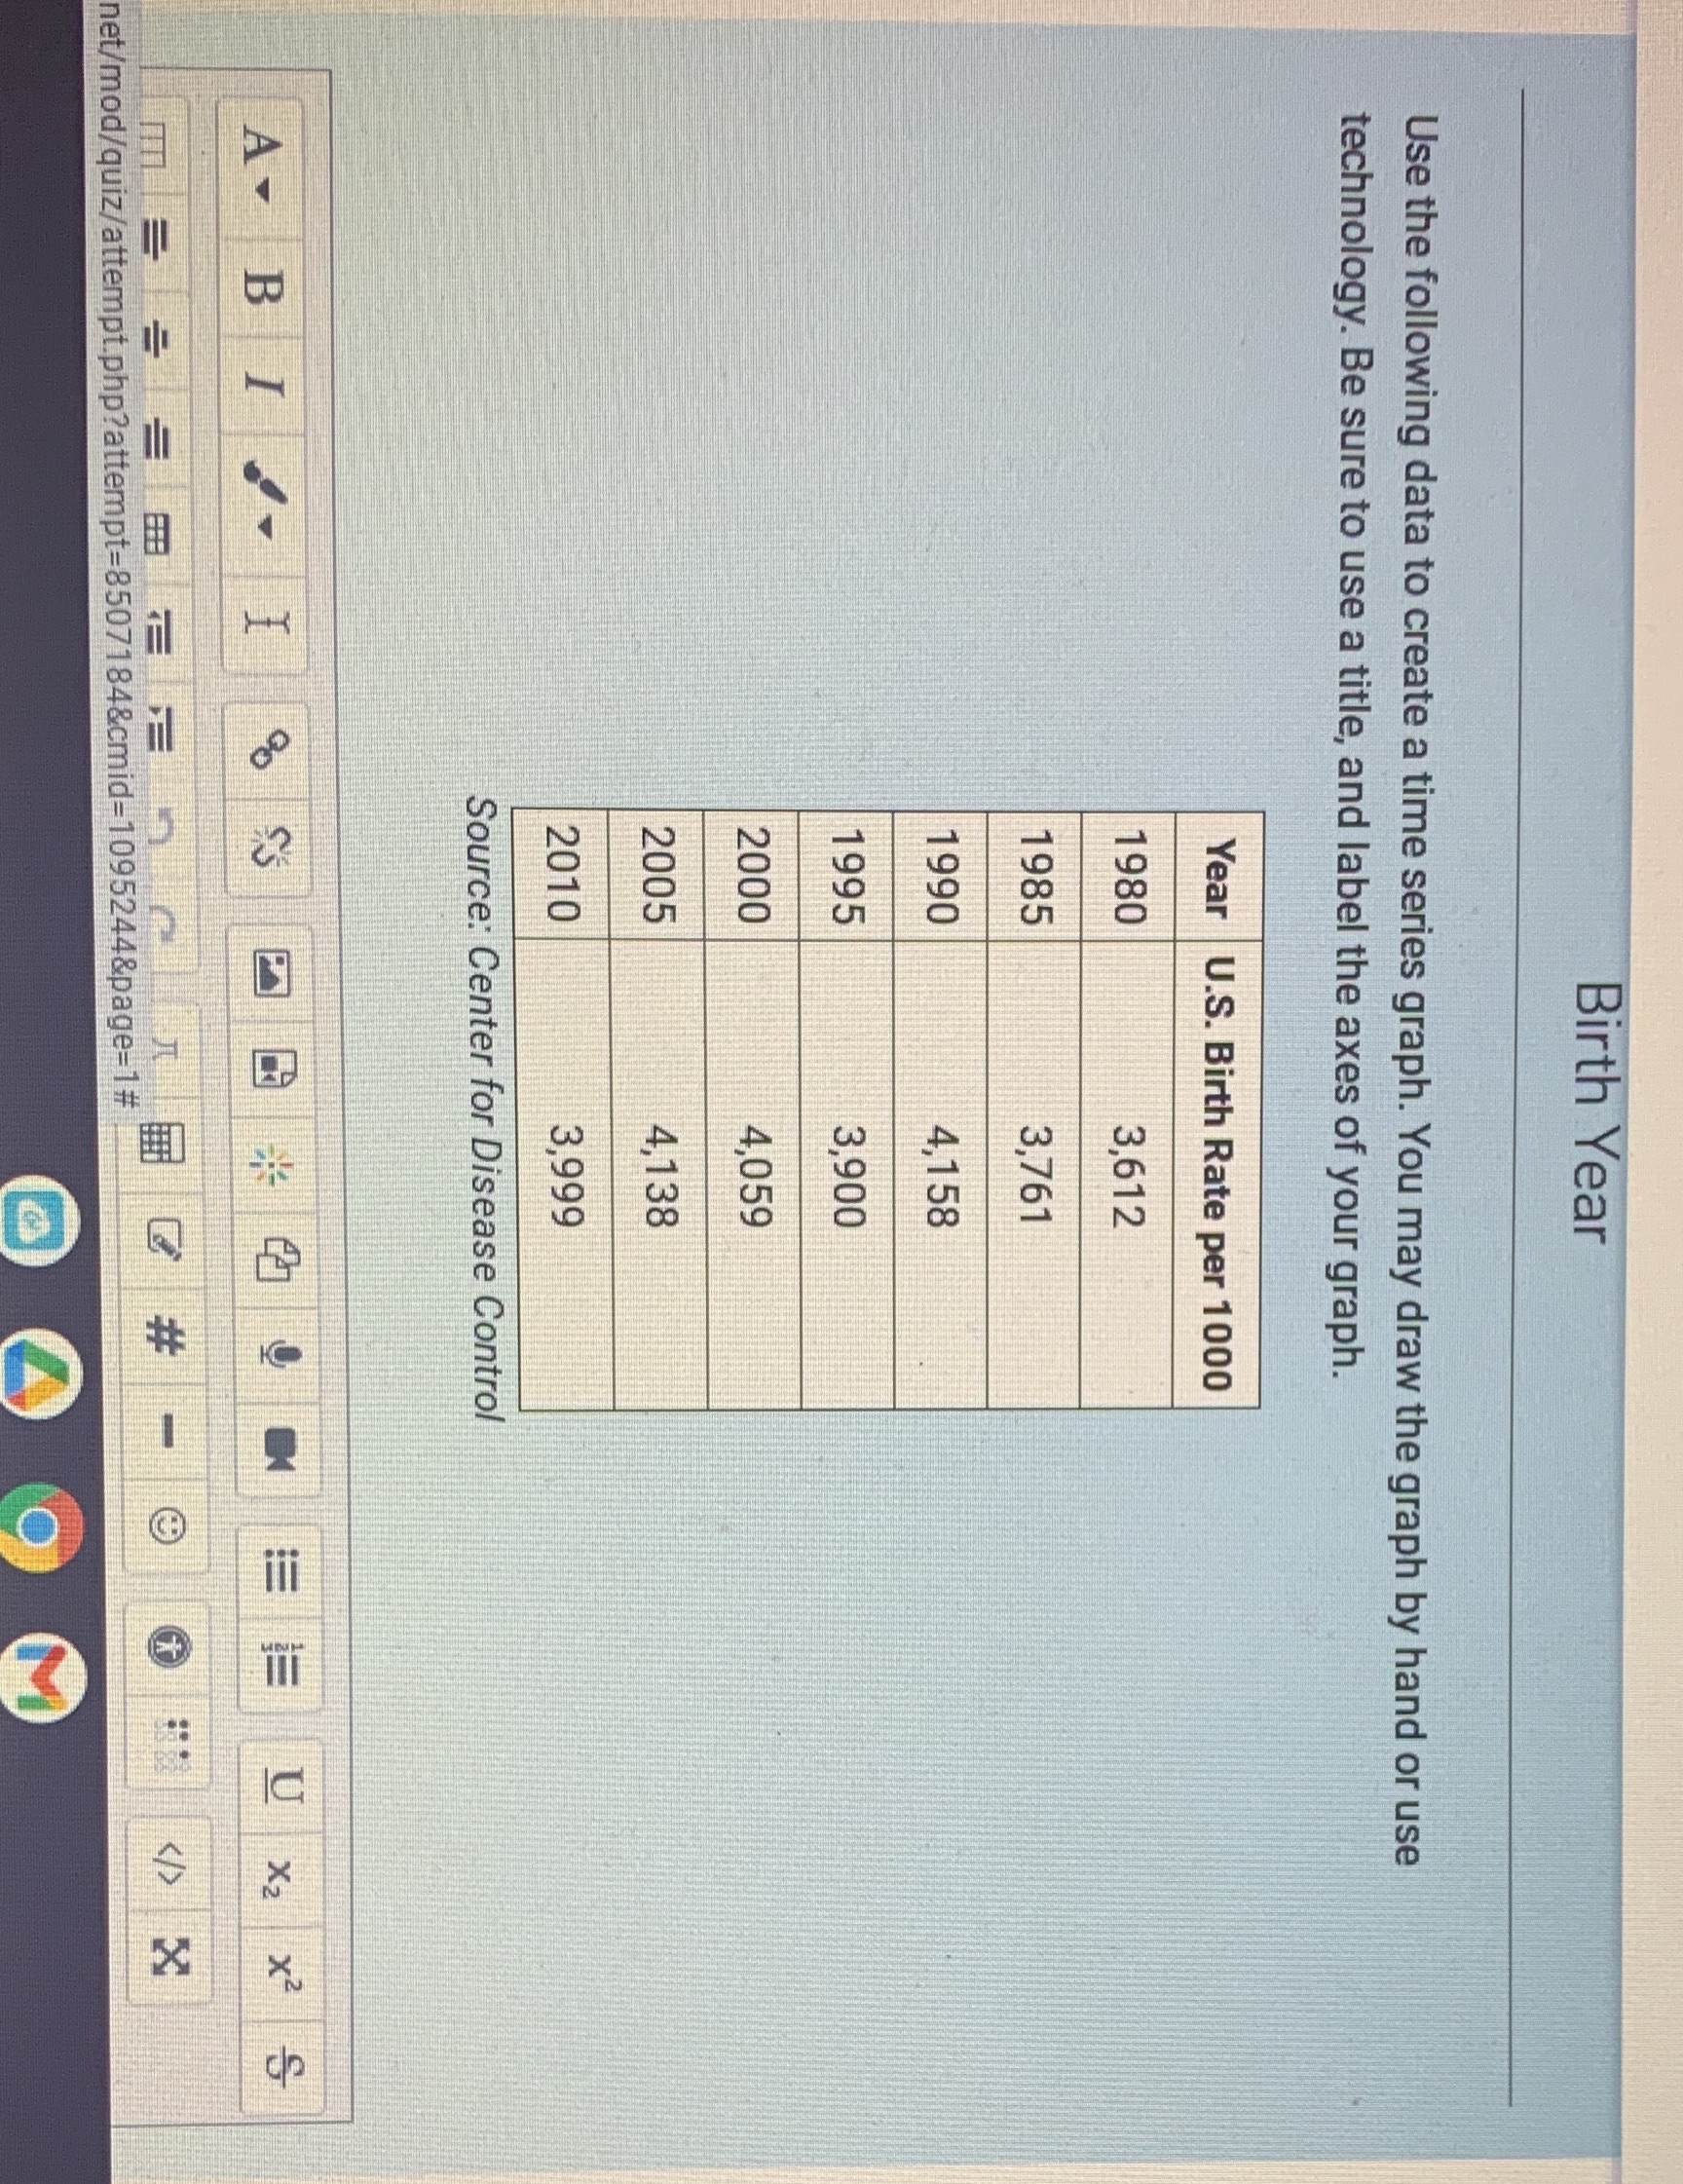
Birth Year Use the following data to create a time series graph. You may draw the graph by hand or use technology. Be sure to use a title, and label the axes of your graph. Year U.S. Birth Rate per 1000 1980 3,612 1985 3,761 1990 4,158 1995 3,900 2000 4,059 2005 4,138 2010 3,999 Source: Center for Disease Control A - !! KC net/mod/quiz/attempt.php?attempt=8507184&cmid=1095244&page=1#
Step by Step Solution
There are 3 Steps involved in it
1 Expert Approved Answer
Step: 1 Unlock

Question Has Been Solved by an Expert!
Get step-by-step solutions from verified subject matter experts
Step: 2 Unlock
Step: 3 Unlock