

Question: Bivariate data obtained for the paired variables x and y are shown below, in the table labeled Sample data. These data are plotted in the
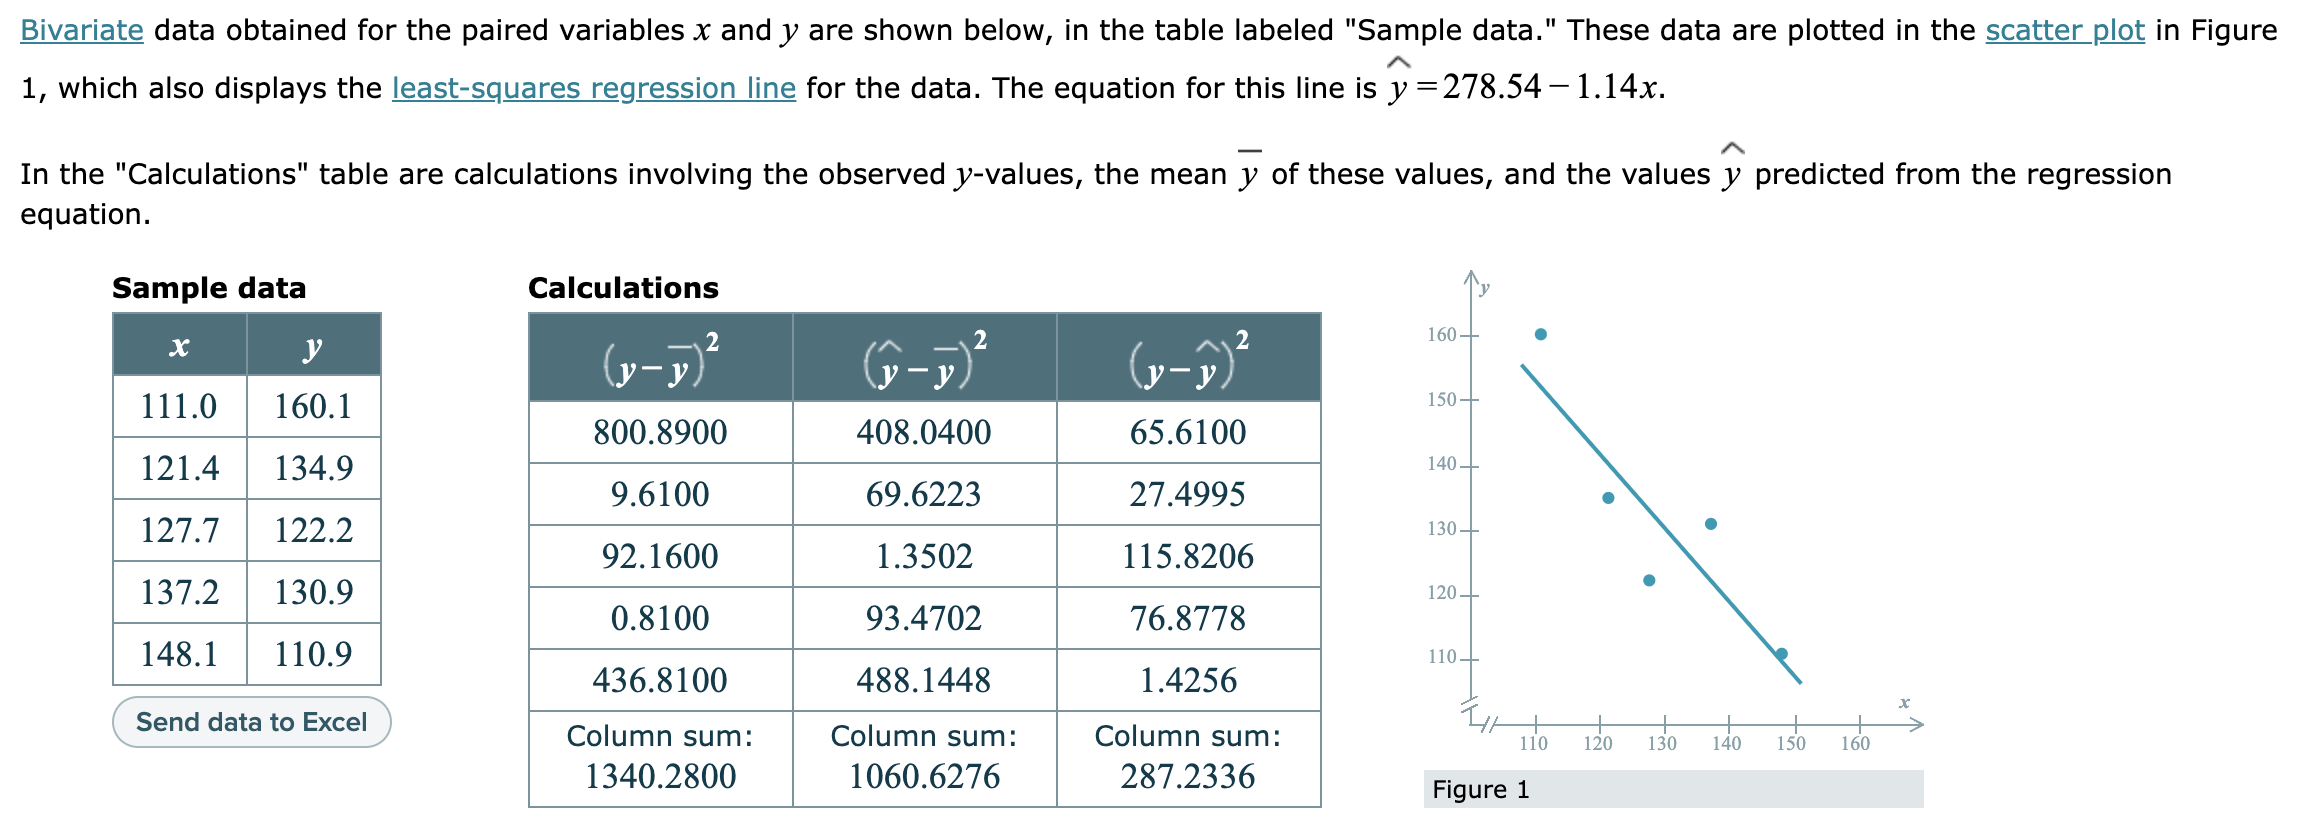
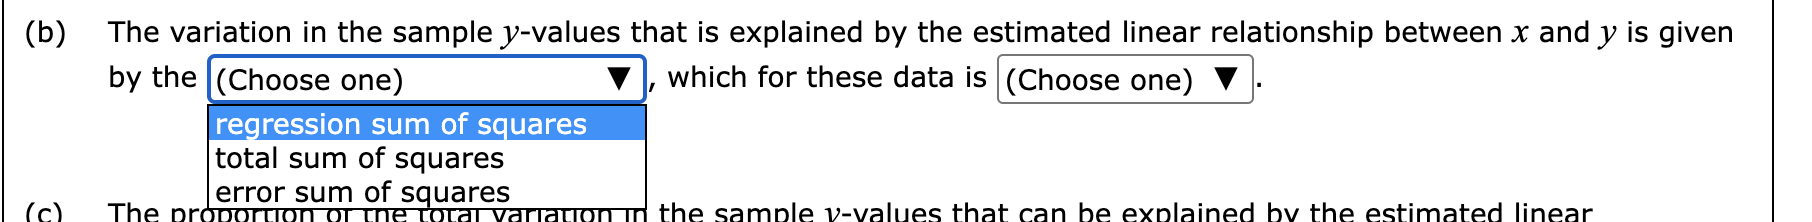
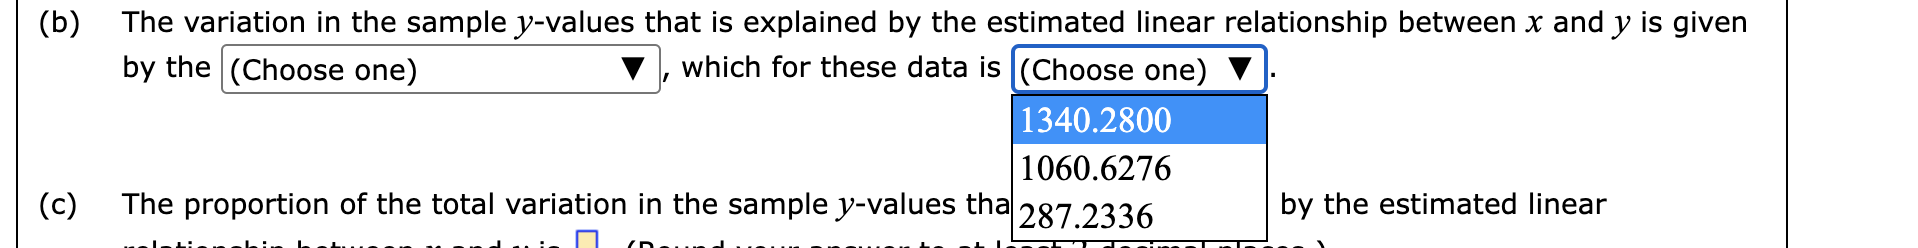
Bivariate data obtained for the paired variables x and y are shown below, in the table labeled "Sample data." These data are plotted in the scatter Wit in Figure A 1, which also displays the least-squares regression line for the data. The equation for this line is y =278.54-1.14x. _ A In the "Calculations" table are calculations involving the observed y-values, the mean y of these values, and the values y predicted from the regression equation. Sample data Calculations y x _ 2 A _ 2 A 2 1
Step by Step Solution
There are 3 Steps involved in it
1 Expert Approved Answer
Step: 1 Unlock

Question Has Been Solved by an Expert!
Get step-by-step solutions from verified subject matter experts
Step: 2 Unlock
Step: 3 Unlock