

Question: ??bookquestion Esub) data 6 Hot Based on the following Range Mean Subgroups 2 4 74.01 73.99 0.07 74.00 0.03 74.05 0.02 73.89 0.07 73.96 0.06
??bookquestion
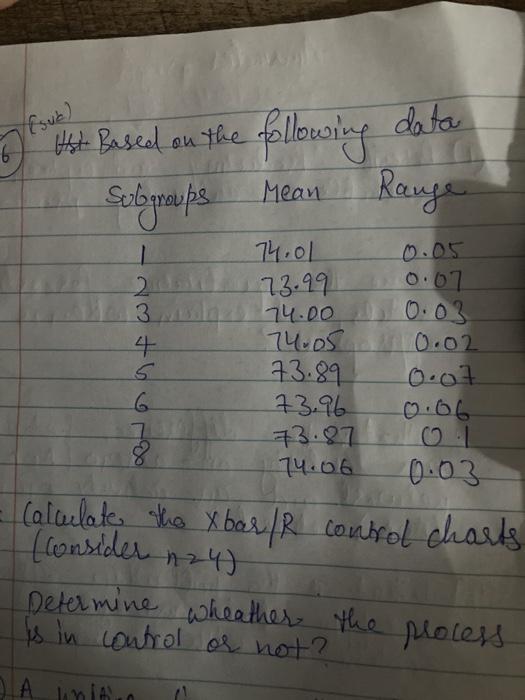
Esub) data 6 Hot Based on the following Range Mean Subgroups 2 4 74.01 73.99 0.07 74.00 0.03 74.05 0.02 73.89 0.07 73.96 0.06 73.87 74.06 0.03 6 Calculate the X bar/R control charts (consider n24) Determine wheather the process . is in control or not? A linan
Step by Step Solution
There are 3 Steps involved in it
1 Expert Approved Answer
Step: 1 Unlock

Question Has Been Solved by an Expert!
Get step-by-step solutions from verified subject matter experts
Step: 2 Unlock
Step: 3 Unlock