

Question: Bootstrap Dotplot of p1 - p2 60 Left Tail Two-Tall Right Tall samples - 100 mean =-0.425 std. error = 0.078 50 40 30 20
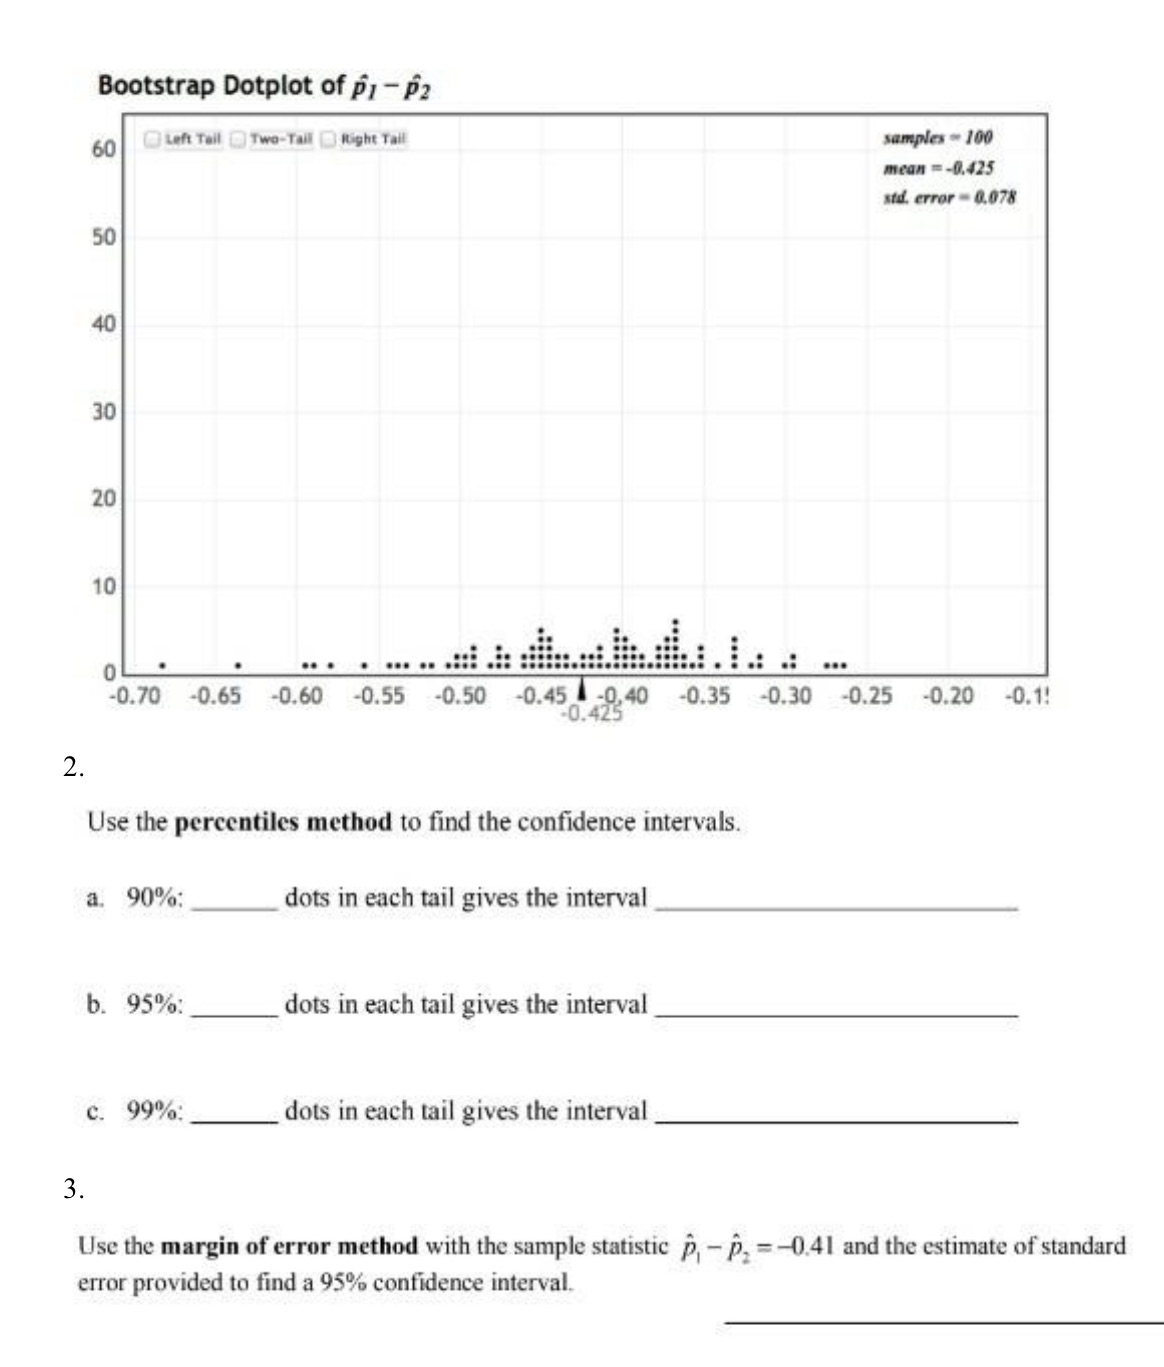
Bootstrap Dotplot of p1 - p2 60 Left Tail Two-Tall Right Tall samples - 100 mean =-0.425 std. error = 0.078 50 40 30 20 10 the. . . ... -0.70 -0.65 -0.60 -0.55 -0.50 -0.45 -0,40 -0.35 -0.30 -0.25 -0.20 -0.1! -0.425 2. Use the percentiles method to find the confidence intervals. a. 90%: dots in each tail gives the interval b. 95%: dots in each tail gives the interval c. 99%: dots in each tail gives the interval 3. Use the margin of error method with the sample statistic p, - p, =-0.41 and the estimate of standard error provided to find a 95% confidence interval
Step by Step Solution
There are 3 Steps involved in it
1 Expert Approved Answer
Step: 1 Unlock

Question Has Been Solved by an Expert!
Get step-by-step solutions from verified subject matter experts
Step: 2 Unlock
Step: 3 Unlock