

Question: BTN 13-2 BTN 13-2 Key comparative figures for Nike, Adidas, and Puma follow. Nike (USS) Adidas (EUR) Puma (EUR) Key Figures 2022 1.80 15.0 Net
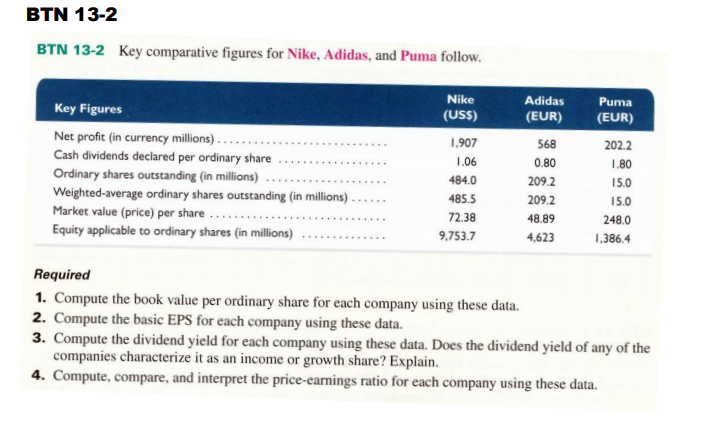
BTN 13-2 BTN 13-2 Key comparative figures for Nike, Adidas, and Puma follow. Nike (USS) Adidas (EUR) Puma (EUR) Key Figures 2022 1.80 15.0 Net profit (in currency millions)....... Cash dividends declared per ordinary share ............ Ordinary shares outstanding in millions) .............. Weighted average ordinary shares outstanding (in millions) Market value (price) per share ...... .. .. Equity applicable to ordinary shares (in millions) ......... 1.907 1.06 484.0 485.5 72.38 9,753.7 568 0.80 209.2 2092 48.89 4,623 15.0 248.0 1.386.4 Required 1. Compute the book value per ordinary share for each company using these data. 2. Compute the basic EPS for each company using these data. 3. Compute the dividend yield for each company using these data. Does the dividend yield of any of the companies characterize it as an income or growth share? Explain. 4. Compute, compare, and interpret the price-earnings ratio for each company using these data
Step by Step Solution
There are 3 Steps involved in it

Get step-by-step solutions from verified subject matter experts