

Question: BTN 13-2 Key figures for Apple and Google follow $ millons Apple Google 16,549 11,556 Cash and equlvalents Accounts receivable, net. Inventories Retained earnings Cost
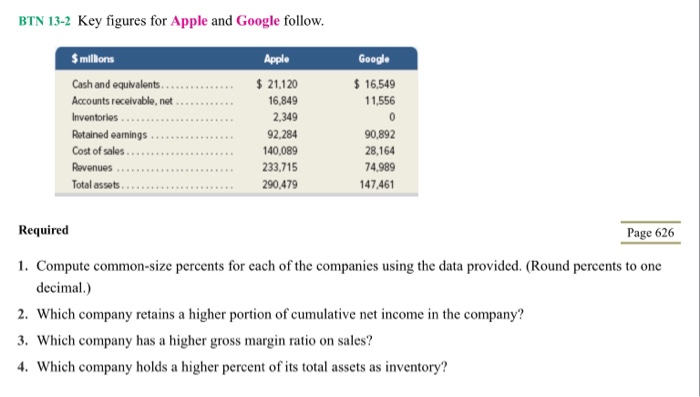
BTN 13-2 Key figures for Apple and Google follow $ millons Apple Google 16,549 11,556 Cash and equlvalents Accounts receivable, net. Inventories Retained earnings Cost of sales Revenues 21.120 6,849 2,349 92,284 140,089 233,715 90,892 28,164 74,989 147,461 Required Page 626 1. Compute common-size percents for each of the companies using the data provided. (Round percents to one decimal.) 2. Which company retains a higher portion of cumulative net income in the company? 3. Which company has a higher gross margin ratio on sales? 4. Which company holds a higher percent of its total assets as inventory
Step by Step Solution
There are 3 Steps involved in it
1 Expert Approved Answer
Step: 1 Unlock

Question Has Been Solved by an Expert!
Get step-by-step solutions from verified subject matter experts
Step: 2 Unlock
Step: 3 Unlock