

Question: By looking at the graph below, explain what is happening here, the language is English. Describe the variable and the variants as well as the
By looking at the graph below, explain what is happening here, the language is English.
Describe the variable and the variants as well as the various factors taken into account.
What is an overall trend? Finally, comment whether this is a feature found in Canada and if so, whether it also follows the same trend.
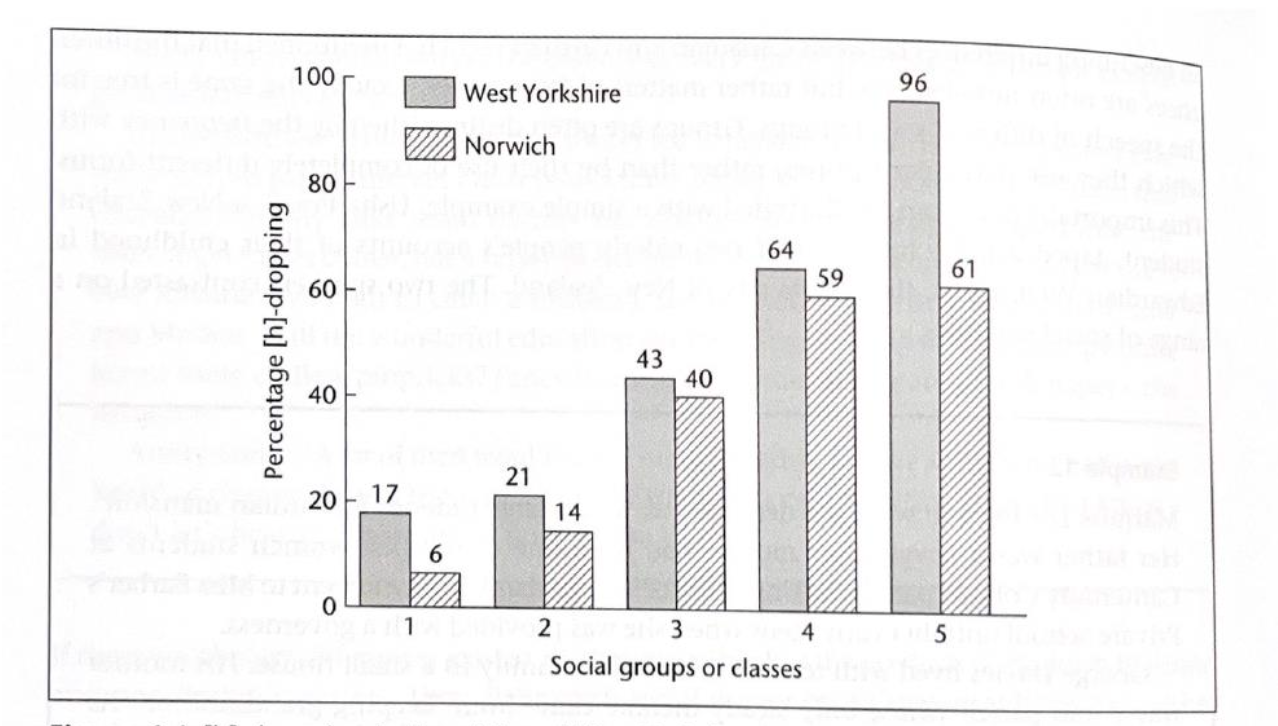
100 West Yorkshire 96 Norwich 80 64 60 59 61 Percentage [h]-dropping 43 40 40 21 20 - 17 14 6 0 2 3 4 5 Social groups or classes
Step by Step Solution
There are 3 Steps involved in it
1 Expert Approved Answer
Step: 1 Unlock

Question Has Been Solved by an Expert!
Get step-by-step solutions from verified subject matter experts
Step: 2 Unlock
Step: 3 Unlock