

By recognizing that your data set consists of smokers and nonsmokers, you gain tremendous power in...
Fantastic news! We've Found the answer you've been seeking!
Question:
Transcribed Image Text:
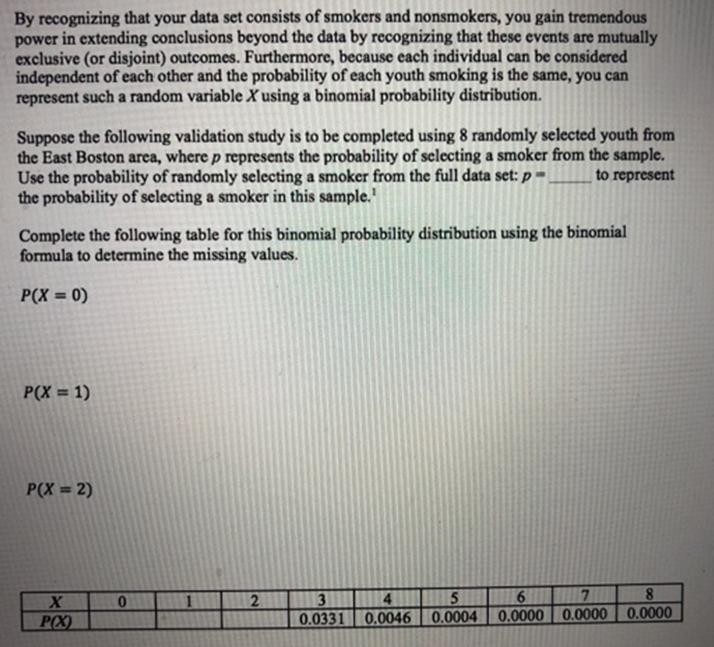
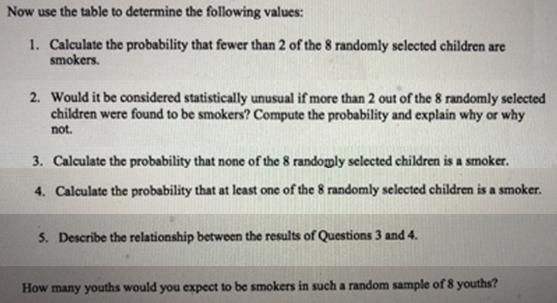
By recognizing that your data set consists of smokers and nonsmokers, you gain tremendous power in extending conclusions beyond the data by recognizing that these events are mutually exclusive (or disjoint) outcomes. Furthermore, because each individual can be considered independent of each other and the probability of each youth smoking is the same, you can represent such a random variable X using a binomial probability distribution. Suppose the following validation study is to be completed using 8 randomly selected youth from the East Boston area, where p represents the probability of selecting a smoker from the sample. Use the probability of randomly selecting a smoker from the full data set: p = the probability of selecting a smoker in this sample. to represent Complete the following table for this binomial probability distribution using the binomial formula to determine the missing values. P(X = 0) %3D P(X = 1) P(X = 2) 17 8. 6. 0.0000 0.0000 0.0000 01 1 3 P(X) 0.0331 0.0046 0.0004 Now use the table to determine the following values: 1. Calculate the probability that fewer than 2 of the 8 randomly selected children are smokers. 2. Would it be considered statistically unusual if more than 2 out of the 8 randomly selected children were found to be smokers? Compute the probability and explain why or why not. 3. Calculate the probability that none of the 8 randomly selected children is a smoker. 4. Calculate the probability that at least one of the 8 randomly selected children is a smoker. 5. Describe the relationship between the results of Questions 3 and 4. How many youths would you expect to be smokers in such a random sample of 8 youths? By recognizing that your data set consists of smokers and nonsmokers, you gain tremendous power in extending conclusions beyond the data by recognizing that these events are mutually exclusive (or disjoint) outcomes. Furthermore, because each individual can be considered independent of each other and the probability of each youth smoking is the same, you can represent such a random variable X using a binomial probability distribution. Suppose the following validation study is to be completed using 8 randomly selected youth from the East Boston area, where p represents the probability of selecting a smoker from the sample. Use the probability of randomly selecting a smoker from the full data set: p = the probability of selecting a smoker in this sample. to represent Complete the following table for this binomial probability distribution using the binomial formula to determine the missing values. P(X = 0) %3D P(X = 1) P(X = 2) 17 8. 6. 0.0000 0.0000 0.0000 01 1 3 P(X) 0.0331 0.0046 0.0004 Now use the table to determine the following values: 1. Calculate the probability that fewer than 2 of the 8 randomly selected children are smokers. 2. Would it be considered statistically unusual if more than 2 out of the 8 randomly selected children were found to be smokers? Compute the probability and explain why or why not. 3. Calculate the probability that none of the 8 randomly selected children is a smoker. 4. Calculate the probability that at least one of the 8 randomly selected children is a smoker. 5. Describe the relationship between the results of Questions 3 and 4. How many youths would you expect to be smokers in such a random sample of 8 youths? By recognizing that your data set consists of smokers and nonsmokers, you gain tremendous power in extending conclusions beyond the data by recognizing that these events are mutually exclusive (or disjoint) outcomes. Furthermore, because each individual can be considered independent of each other and the probability of each youth smoking is the same, you can represent such a random variable X using a binomial probability distribution. Suppose the following validation study is to be completed using 8 randomly selected youth from the East Boston area, where p represents the probability of selecting a smoker from the sample. Use the probability of randomly selecting a smoker from the full data set: p = the probability of selecting a smoker in this sample. to represent Complete the following table for this binomial probability distribution using the binomial formula to determine the missing values. P(X = 0) %3D P(X = 1) P(X = 2) 17 8. 6. 0.0000 0.0000 0.0000 01 1 3 P(X) 0.0331 0.0046 0.0004 Now use the table to determine the following values: 1. Calculate the probability that fewer than 2 of the 8 randomly selected children are smokers. 2. Would it be considered statistically unusual if more than 2 out of the 8 randomly selected children were found to be smokers? Compute the probability and explain why or why not. 3. Calculate the probability that none of the 8 randomly selected children is a smoker. 4. Calculate the probability that at least one of the 8 randomly selected children is a smoker. 5. Describe the relationship between the results of Questions 3 and 4. How many youths would you expect to be smokers in such a random sample of 8 youths? By recognizing that your data set consists of smokers and nonsmokers, you gain tremendous power in extending conclusions beyond the data by recognizing that these events are mutually exclusive (or disjoint) outcomes. Furthermore, because each individual can be considered independent of each other and the probability of each youth smoking is the same, you can represent such a random variable X using a binomial probability distribution. Suppose the following validation study is to be completed using 8 randomly selected youth from the East Boston area, where p represents the probability of selecting a smoker from the sample. Use the probability of randomly selecting a smoker from the full data set: p = the probability of selecting a smoker in this sample. to represent Complete the following table for this binomial probability distribution using the binomial formula to determine the missing values. P(X = 0) %3D P(X = 1) P(X = 2) 17 8. 6. 0.0000 0.0000 0.0000 01 1 3 P(X) 0.0331 0.0046 0.0004 Now use the table to determine the following values: 1. Calculate the probability that fewer than 2 of the 8 randomly selected children are smokers. 2. Would it be considered statistically unusual if more than 2 out of the 8 randomly selected children were found to be smokers? Compute the probability and explain why or why not. 3. Calculate the probability that none of the 8 randomly selected children is a smoker. 4. Calculate the probability that at least one of the 8 randomly selected children is a smoker. 5. Describe the relationship between the results of Questions 3 and 4. How many youths would you expect to be smokers in such a random sample of 8 youths? By recognizing that your data set consists of smokers and nonsmokers, you gain tremendous power in extending conclusions beyond the data by recognizing that these events are mutually exclusive (or disjoint) outcomes. Furthermore, because each individual can be considered independent of each other and the probability of each youth smoking is the same, you can represent such a random variable X using a binomial probability distribution. Suppose the following validation study is to be completed using 8 randomly selected youth from the East Boston area, where p represents the probability of selecting a smoker from the sample. Use the probability of randomly selecting a smoker from the full data set: p = the probability of selecting a smoker in this sample. to represent Complete the following table for this binomial probability distribution using the binomial formula to determine the missing values. P(X = 0) %3D P(X = 1) P(X = 2) 17 8. 6. 0.0000 0.0000 0.0000 01 1 3 P(X) 0.0331 0.0046 0.0004 Now use the table to determine the following values: 1. Calculate the probability that fewer than 2 of the 8 randomly selected children are smokers. 2. Would it be considered statistically unusual if more than 2 out of the 8 randomly selected children were found to be smokers? Compute the probability and explain why or why not. 3. Calculate the probability that none of the 8 randomly selected children is a smoker. 4. Calculate the probability that at least one of the 8 randomly selected children is a smoker. 5. Describe the relationship between the results of Questions 3 and 4. How many youths would you expect to be smokers in such a random sample of 8 youths? By recognizing that your data set consists of smokers and nonsmokers, you gain tremendous power in extending conclusions beyond the data by recognizing that these events are mutually exclusive (or disjoint) outcomes. Furthermore, because each individual can be considered independent of each other and the probability of each youth smoking is the same, you can represent such a random variable X using a binomial probability distribution. Suppose the following validation study is to be completed using 8 randomly selected youth from the East Boston area, where p represents the probability of selecting a smoker from the sample. Use the probability of randomly selecting a smoker from the full data set: p = the probability of selecting a smoker in this sample. to represent Complete the following table for this binomial probability distribution using the binomial formula to determine the missing values. P(X = 0) %3D P(X = 1) P(X = 2) 17 8. 6. 0.0000 0.0000 0.0000 01 1 3 P(X) 0.0331 0.0046 0.0004 Now use the table to determine the following values: 1. Calculate the probability that fewer than 2 of the 8 randomly selected children are smokers. 2. Would it be considered statistically unusual if more than 2 out of the 8 randomly selected children were found to be smokers? Compute the probability and explain why or why not. 3. Calculate the probability that none of the 8 randomly selected children is a smoker. 4. Calculate the probability that at least one of the 8 randomly selected children is a smoker. 5. Describe the relationship between the results of Questions 3 and 4. How many youths would you expect to be smokers in such a random sample of 8 youths? By recognizing that your data set consists of smokers and nonsmokers, you gain tremendous power in extending conclusions beyond the data by recognizing that these events are mutually exclusive (or disjoint) outcomes. Furthermore, because each individual can be considered independent of each other and the probability of each youth smoking is the same, you can represent such a random variable X using a binomial probability distribution. Suppose the following validation study is to be completed using 8 randomly selected youth from the East Boston area, where p represents the probability of selecting a smoker from the sample. Use the probability of randomly selecting a smoker from the full data set: p = the probability of selecting a smoker in this sample. to represent Complete the following table for this binomial probability distribution using the binomial formula to determine the missing values. P(X = 0) %3D P(X = 1) P(X = 2) 17 8. 6. 0.0000 0.0000 0.0000 01 1 3 P(X) 0.0331 0.0046 0.0004 Now use the table to determine the following values: 1. Calculate the probability that fewer than 2 of the 8 randomly selected children are smokers. 2. Would it be considered statistically unusual if more than 2 out of the 8 randomly selected children were found to be smokers? Compute the probability and explain why or why not. 3. Calculate the probability that none of the 8 randomly selected children is a smoker. 4. Calculate the probability that at least one of the 8 randomly selected children is a smoker. 5. Describe the relationship between the results of Questions 3 and 4. How many youths would you expect to be smokers in such a random sample of 8 youths? By recognizing that your data set consists of smokers and nonsmokers, you gain tremendous power in extending conclusions beyond the data by recognizing that these events are mutually exclusive (or disjoint) outcomes. Furthermore, because each individual can be considered independent of each other and the probability of each youth smoking is the same, you can represent such a random variable X using a binomial probability distribution. Suppose the following validation study is to be completed using 8 randomly selected youth from the East Boston area, where p represents the probability of selecting a smoker from the sample. Use the probability of randomly selecting a smoker from the full data set: p = the probability of selecting a smoker in this sample. to represent Complete the following table for this binomial probability distribution using the binomial formula to determine the missing values. P(X = 0) %3D P(X = 1) P(X = 2) 17 8. 6. 0.0000 0.0000 0.0000 01 1 3 P(X) 0.0331 0.0046 0.0004 Now use the table to determine the following values: 1. Calculate the probability that fewer than 2 of the 8 randomly selected children are smokers. 2. Would it be considered statistically unusual if more than 2 out of the 8 randomly selected children were found to be smokers? Compute the probability and explain why or why not. 3. Calculate the probability that none of the 8 randomly selected children is a smoker. 4. Calculate the probability that at least one of the 8 randomly selected children is a smoker. 5. Describe the relationship between the results of Questions 3 and 4. How many youths would you expect to be smokers in such a random sample of 8 youths?
Expert Answer:
Answer rating: 100% (QA)
Required solution PX 3 8 C 3 p 3 1p 5 00331 PX 3 56 p 3 1p 5 00331 1 PX 4 8 C 4 p 4 1p 4 000... View the full answer

Related Book For 

Probability and Statistics for Engineering and the Sciences
ISBN: 978-1305251809
9th edition
Authors: Jay L. Devore
Posted Date:
Students also viewed these accounting questions
-
A random variable x can assume five values: 0, 1, 2, 3, 4. A portion of the probability distribution is shown here: a. Find p(3). b. Construct a probability histogram for p(x). c. Calculate the...
-
A random variable X has density function proportional to Use R to find P(1/8 < X < 1/4). f(x) = for 0 < x < 1. (1 2)
-
The mean and standard deviation for a random variable x are 5.0 and 2.0, respectively. Find the mean and standard deviation if a. each value of x is increased by 3 b. each value of x is multiplied...
-
Q-1 A motor car shaft consists of a steel tube 30 mm internal diameter and 4 mm thick. The engine develops 10 kW at 2000 r.p.m. Find the maximum shear stress in the tube when the power is transmitted...
-
aFashion the references that you find for your annotated bibliography into two paragraphs of a literature review for your topic. Make reference to the style guidelines in this chapter?
-
1. How well did Matrixs client handle this situation? 2. What kind of message does this send to the employees of Matrixs client? 3. What other options were available here? 4. On the assumption that...
-
Plaintiffs James and Betty Tonkovich own approximately 850 acres of in Belmont County, Ohio. Plaintiffs belong to a group of landowners known as Belmont Leasing Group, which leases land for oil and...
-
Following is a trial balance of the accounts of the Bureau of Bridge Inspection (BOBI), a relatively new unit of the Department of Transportation (DOT), as of October 1, 2013. BOBI is responsible for...
-
1) Write a Python function to convert mass values from gram to ounce and return the conversion result. The conversion formula is ounce = gram x 0.035274. The function header is: def gm_to_ounce...
-
Harrell and Smith, Inc., 204 Ambulance Street, Anywhere, CA 92345, is a corporation (EIN 57-1234567) formed on January 1, 2010. Information concerning the corporation and its two shareholders...
-
Pedro's Pizza makes frozen pizza dough. The company just finished its first year of operation (12 months, Jan-Dec). The following is its traditional income statement and Balance Sheet Sales (15,000...
-
2. What is the future value of an annuity retirement account if you deposit $2500 every year for 35 years? Assume the interest rate is 5.5% per year.
-
In 2013, Senate Democrats then in the majority triggered what was called the "nuclear option" for the first time. Frustrated with what they considered the relentless Republican obstruction of...
-
Establish the factors that must be taken into consideration and take into account the factors of sustainability, differentiation and growth?
-
A mass of 200 gms hangs from the rim of a wheel of radius 5 cm. Mass falls from rest to 2m in 5 sec. find the moment of inertia of the wheel?
-
2) Clifton's Parks and Recreation Department is introducing a new summer day camp for children in elementary school, providing programming from 8:00 a.m. to 5:00 p.m. Monday through Friday. The...
-
Assess the impact of artificial intelligence on decision-making processes within business management. Explore how machine learning algorithms, predictive analytics, and automation are influencing...
-
At 31 December 20X9, the end of the annual reporting period, the accounts of Huron Company showed the following: a. Sales revenue for 20X9, $ 2,950,000, of which one- quarter was on credit. b....
-
Cortisol is a hormone that plays an important role in mediating stress. There is growing awareness that exposure of outdoor workers to pollutants may impact cortisol levels. The article "Plasma...
-
In cost estimation, the total cost of a project is the sum of component task costs. Each of these costs is a random variable with a probability distribution. It is customary to obtain information...
-
One piece of PVC pipe is to be inserted inside another piece. The length of the first piece is normally distributed with mean value 20 in. and standard deviation .5 in. The length of the second piece...
-
Working by yourself or with a small group of classmates, identify at least two ways that Noah and Kelly can use their website to increase their credibility as part of their persuasive strategy.
-
What are the benefits of not saying no immediately to a client request that cannot be fulfilled? Are there any potential pitfalls to this strategy?
-
How can Noah and Kelly learn this information? What would you do?

Study smarter with the SolutionInn App