

Question: C) (28 pts.) Bode Diagrams: For each part plot both the magnitude and phase Bode diagrams. (Each part 7pts) 1) Using MATLAB, plot Bode diagrams
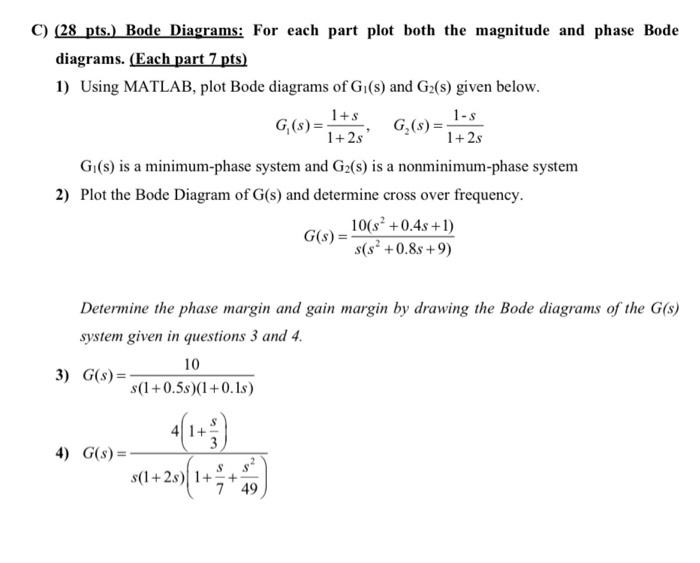
C) (28 pts.) Bode Diagrams: For each part plot both the magnitude and phase Bode diagrams. (Each part 7pts) 1) Using MATLAB, plot Bode diagrams of G1(s) and G2(s) given below. G1(s)=1+2s1+s,G2(s)=1+2s1s G1(s) is a minimum-phase system and G2(s) is a nonminimum-phase system 2) Plot the Bode Diagram of G(s) and determine cross over frequency. G(s)=s(s2+0.8s+9)10(s2+0.4s+1) Determine the phase margin and gain margin by drawing the Bode diagrams of the G(s) system given in questions 3 and 4. 3) G(s)=s(1+0.5s)(1+0.1s)10 4) G(s)=s(1+2s)(1+7s+49s2)4(1+3s)
Step by Step Solution
There are 3 Steps involved in it
1 Expert Approved Answer
Step: 1 Unlock

Question Has Been Solved by an Expert!
Get step-by-step solutions from verified subject matter experts
Step: 2 Unlock
Step: 3 Unlock