

Question: c) Complete the table below for the mean and standard deviation of the given portfolios. (10 marks) Hint: Use the weights in decimals in
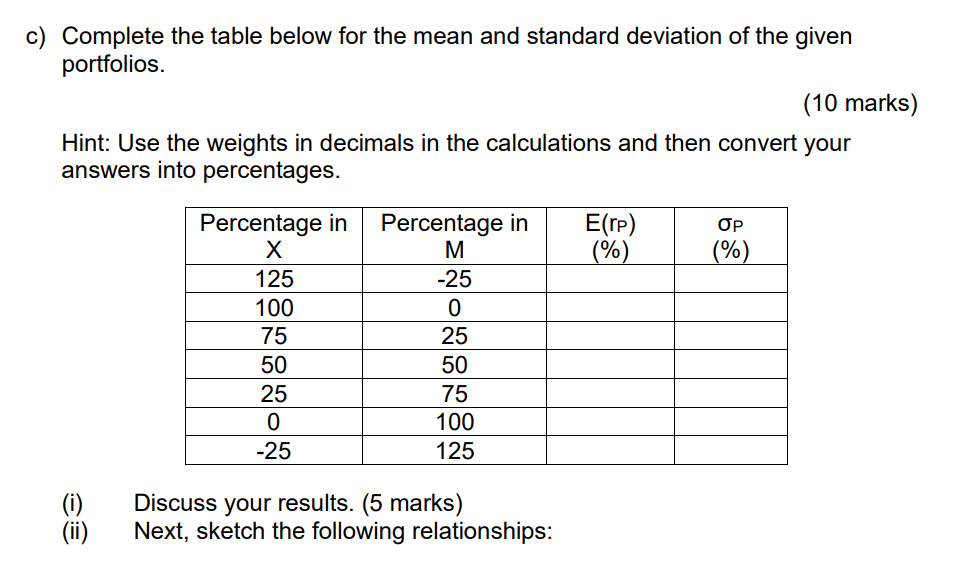
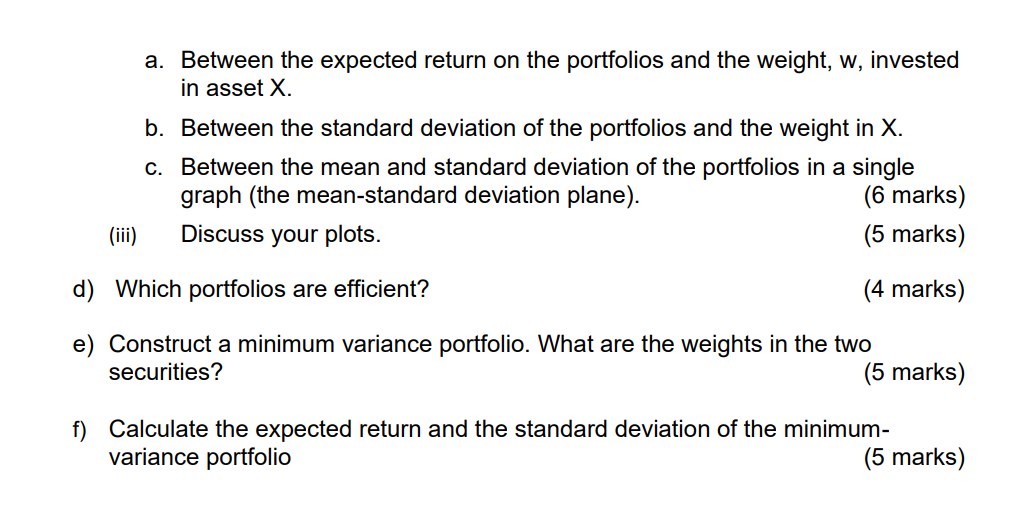
c) Complete the table below for the mean and standard deviation of the given portfolios. (10 marks) Hint: Use the weights in decimals in the calculations and then convert your answers into percentages. Percentage in Percentage in E(rp) (%) (%) X M 125 -25 100 0 75 25 50 50 25 75 0 100 -25 125 33 (ii) Discuss your results. (5 marks) Next, sketch the following relationships: a. Between the expected return on the portfolios and the weight, w, invested in asset X. b. Between the standard deviation of the portfolios and the weight in X. c. Between the mean and standard deviation of the portfolios in a single graph (the mean-standard deviation plane). (iii) Discuss your plots. (6 marks) (5 marks) d) Which portfolios are efficient? (4 marks) e) Construct a minimum variance portfolio. What are the weights in the two securities? (5 marks) f) Calculate the expected return and the standard deviation of the minimum- variance portfolio (5 marks)
Step by Step Solution
There are 3 Steps involved in it
To complete the table we need to calculate the mean and standard deviation of each portfolio Portfol... View full answer

Get step-by-step solutions from verified subject matter experts