

Question: c. Conclude whether to reject the null hypothesis or not based on the test statistic. O Reject O Fail to RejectA random sample of n1
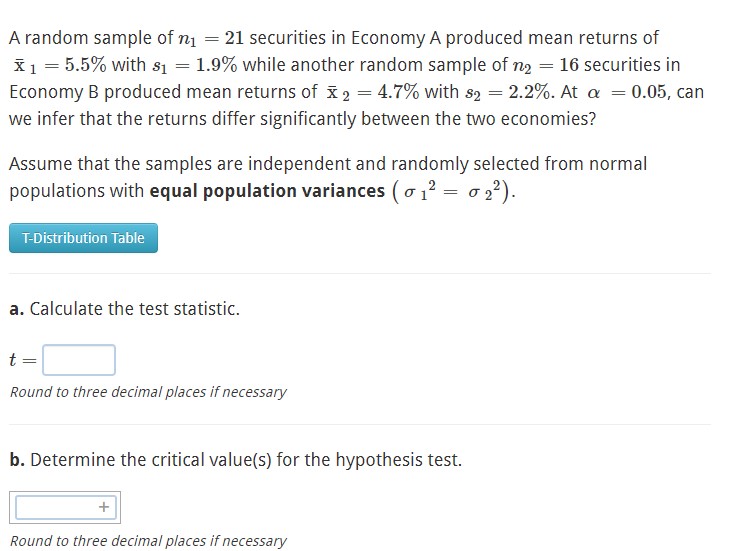
c. Conclude whether to reject the null hypothesis or not based on the test statistic. O Reject O Fail to RejectA random sample of n1 = 21 securities in Economy A produced mean returns of x 1 = 5.5% with $1 = 1.9% while another random sample of n2 = 16 securities in Economy B produced mean returns of x 2 = 4.7% with $2 = 2.2%. At a = 0.05, can we infer that the returns differ significantly between the two economies? Assume that the samples are independent and randomly selected from normal populations with equal population variances ( o 12 = 0 22). T-Distribution Table a. Calculate the test statistic. t = Round to three decimal places if necessary b. Determine the critical value(s) for the hypothesis test. + Round to three decimal places if necessary
Step by Step Solution
There are 3 Steps involved in it

Get step-by-step solutions from verified subject matter experts