

Question: C Get Homework Help with Assignment2 (3).pdf Bwekyb3d8bbwe/TempState/Downloads/Assignment2%20(3).pdf - + F Statistical Process Control: Part B 1. Martha's Wonderful Cookie Company makes a special super-chocolate
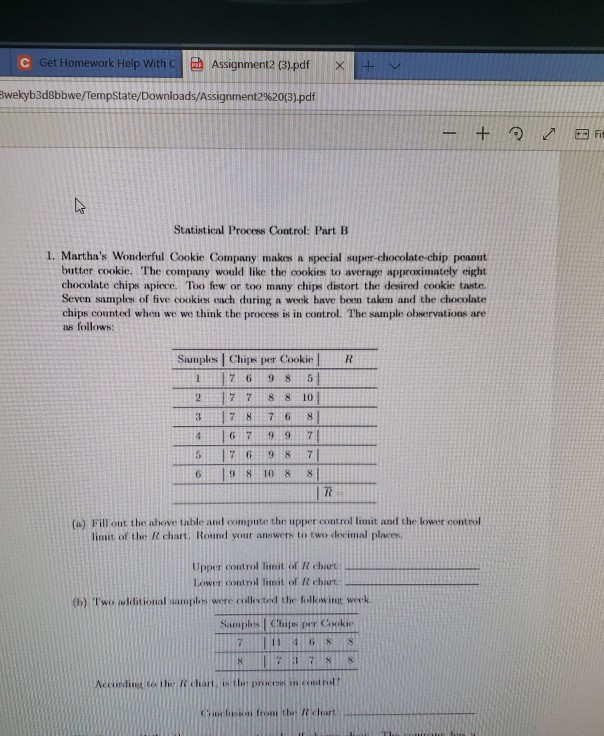
C Get Homework Help with Assignment2 (3).pdf Bwekyb3d8bbwe/TempState/Downloads/Assignment2%20(3).pdf - + F Statistical Process Control: Part B 1. Martha's Wonderful Cookie Company makes a special super-chocolate chip peanut butter cookie. The company would like the cookies to average approximately eight chocolate chips wpiece. Too few or too many chips distort the desired cookie taste. Seven samples of five cookies each during a week have been taken and the chocolate chips counted when we we think the process is in control. The sample observations are as follows: R Samples Chips per Cookie 17 6 9 8 5 2 17 7 8 8 10 3 7 8 7 6 8 16 7 9 9 7 5 17 6 9 8 7|| 6 9 8 10 8 81 IN FI out the above thble and compute the per controllimit and the lower control limit of the chart. Round your answer to two decimal places, Upper controllimit of chart: Lower controllimit of a chart (1) Twoulditional samples were collected the following werk Samples | Chips per Cake Accurding to the chart is the procese in control son from the chart LINO
Step by Step Solution
There are 3 Steps involved in it
1 Expert Approved Answer
Step: 1 Unlock

Question Has Been Solved by an Expert!
Get step-by-step solutions from verified subject matter experts
Step: 2 Unlock
Step: 3 Unlock