

Question: c. Given the following Treasury bond yield information, construct a graph of the yield curve. Yield 5.27% 5.32 5.47 Maturity 1 year 2 years 3
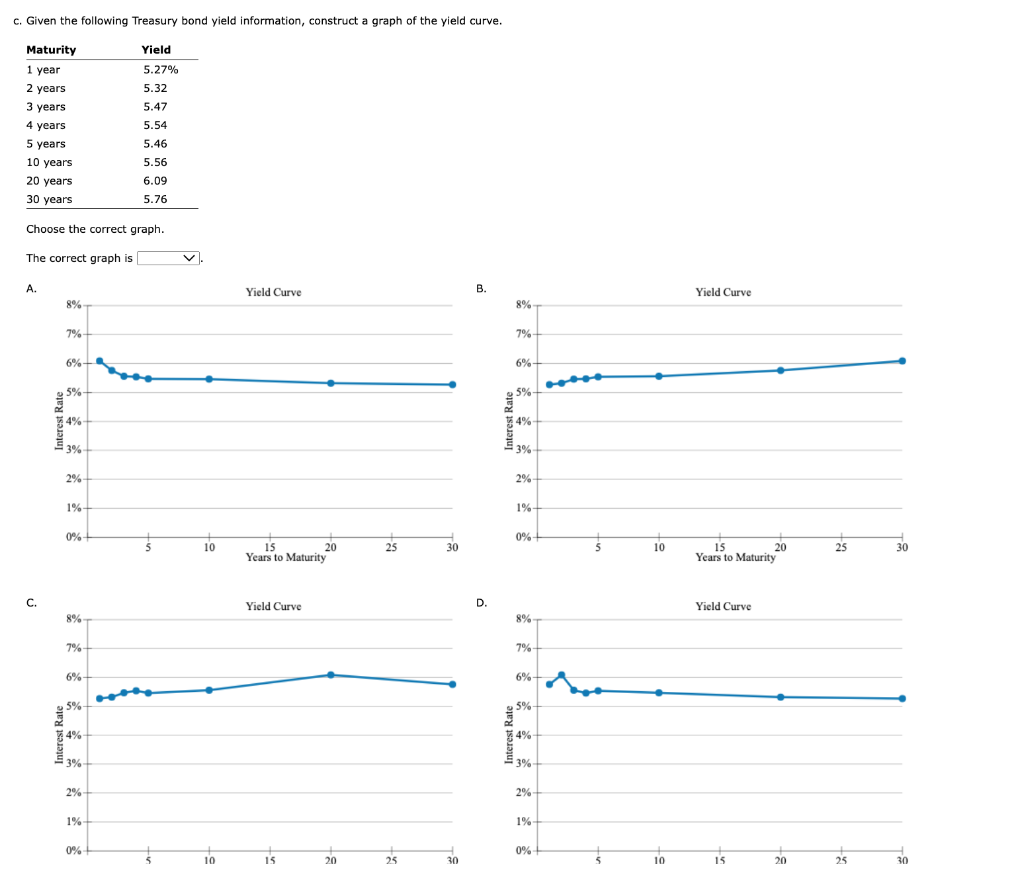
c. Given the following Treasury bond yield information, construct a graph of the yield curve. Yield 5.27% 5.32 5.47 Maturity 1 year 2 years 3 years 3 4 years 5 years 10 years 20 years 30 years 5.54 5.46 5.56 6.09 5.76 Choose the correct graph. The correct graph is A. Yield Curve B. Yield Curve 8% 8% 7% 7% 6% +1 6% + 5% 25 5% 4% 4% 3% 3% 2% 2% 1% 1 1% 0% 0% 10 25 30 10 25 30 15 20 Years to Maturity 15 20 Years to Maturity C. Yield Curve D. Yield Curve 8% 8% 7% 7% 6% 6% 5% 5% 74% 4 4% 3% 3% 2% 2% 1% 1% 0% 0% 10 15 20 25 30 t 10 15 20 25 30
Step by Step Solution
There are 3 Steps involved in it
1 Expert Approved Answer
Step: 1 Unlock

Question Has Been Solved by an Expert!
Get step-by-step solutions from verified subject matter experts
Step: 2 Unlock
Step: 3 Unlock