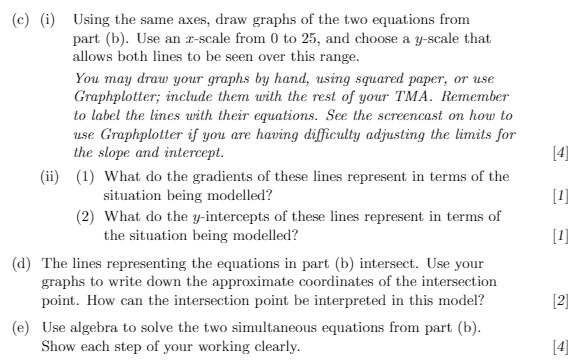
Question: (c) (i) Using the same axes, draw graphs of the two equations from part (b). Use an r-scale from 0 to 25, and choose a

(c) (i) Using the same axes, draw graphs of the
(c) (i) Using the same axes, draw graphs of the two equations from part (b). Use an r-scale from 0 to 25, and choose a y-scale that allows both lines to be seen over this range. You may draw your graphs by hand, using squared paper, or use Graphplotter; include them with the rest of your TMA. Remember to label the lines with their equations. See the screencast on how to use Graphplotter if you are having difficulty adjusting the limits for the slope and intercept. [4] (ii) (1) What do the gradients of these lines represent in terms of the situation being modelled? [1] (2) What do the y-intercepts of these lines represent in terms of the situation being modelled? [1] (d) The lines representing the equations in part (b) intersect. Use your graphs to write down the approximate coordinates of the intersection point. How can the intersection point be interpreted in this model? [2] (e) Use algebra to solve the two simultaneous equations from part (b). Show each step of your working clearly. [4]

Step by Step Solution

There are 3 Steps involved in it

1 Expert Approved Answer
Step: 1 Unlock blur-text-image
Question Has Been Solved by an Expert!

Get step-by-step solutions from verified subject matter experts

Step: 2 Unlock
Step: 3 Unlock

Students Have Also Explored These Related Mathematics Questions!