

Question: c ) Standard Addition Variable Volume Calibration Curve i . Use the following data and Excel to plot a standard addition variable volume calibration curve.
c Standard Addition Variable Volume Calibration Curve
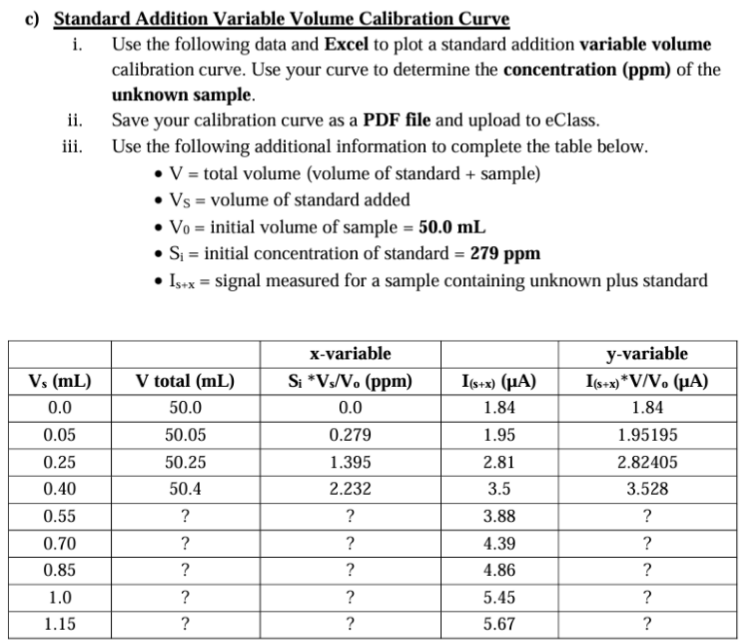
i Use the following data and Excel to plot a standard addition variable volume
calibration curve. Use your curve to determine the concentration ppm of the
unknown sample.
ii Save your calibration curve as a PDF file and upload to eClass.
iii. Use the following additional information to complete the table below.
total volume volume of standard sample
volume of standard added
initial volume of sample
initial concentration of standard
signal measured for a sample containing unknown plus standard
Step by Step Solution
There are 3 Steps involved in it
1 Expert Approved Answer
Step: 1 Unlock

Question Has Been Solved by an Expert!
Get step-by-step solutions from verified subject matter experts
Step: 2 Unlock
Step: 3 Unlock