

Question: c) What are the control limits for the range chart? d) Is the process in control? (a and b are in the picture) $6.10 A
c) What are the control limits for the range chart? d) Is the process in control?
(a and b are in the picture)
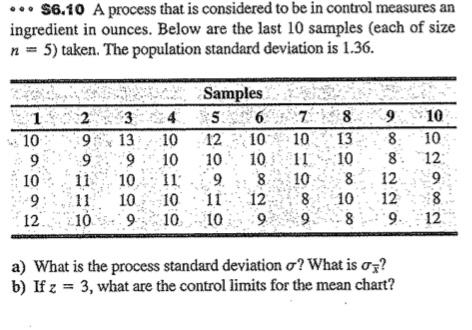
$6.10 A process that is considered to be in control measures an ingredient in ounces. Below are the last 10 samples (each of size n=5 ) taken. The population standard deviation is 1.36 . a) What is the process standard deviation ? What is x ? b) If z=3, what are the control limits for the mean chart
Step by Step Solution
There are 3 Steps involved in it
1 Expert Approved Answer
Step: 1 Unlock

Question Has Been Solved by an Expert!
Get step-by-step solutions from verified subject matter experts
Step: 2 Unlock
Step: 3 Unlock