

Question: please answer B) what are the control limits for the range chart? UCLr= ? ounces LCLx=? ounces Refer to the table Factors for Compuling Control
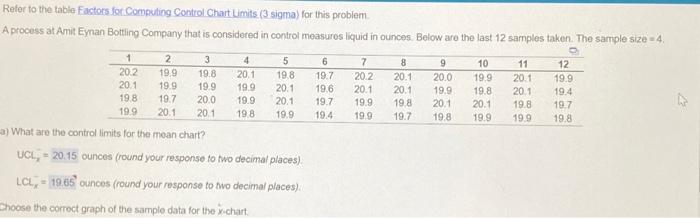
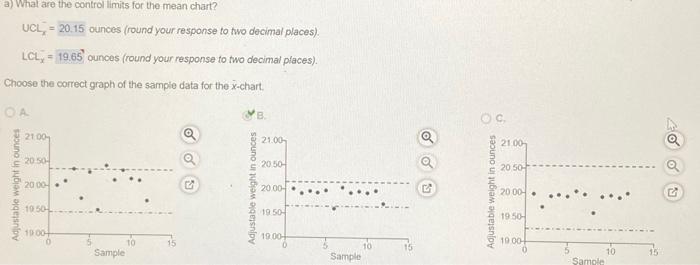
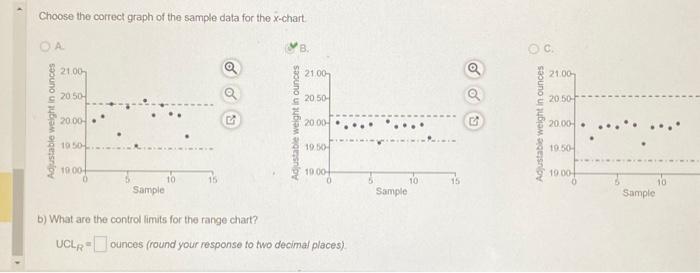
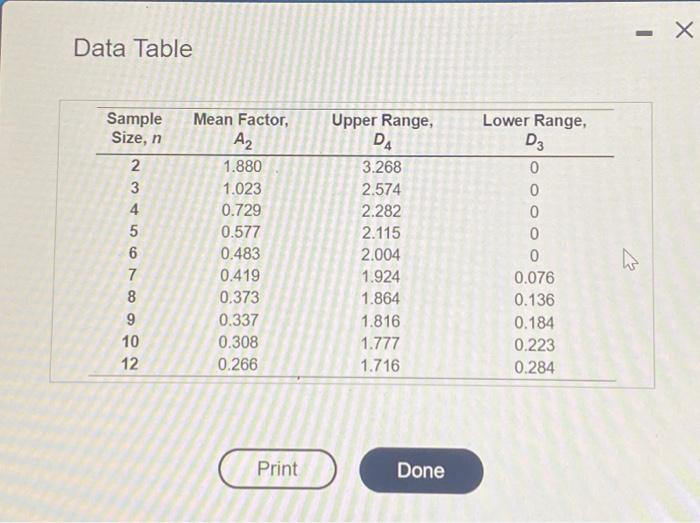
Refer to the table Factors for Compuling Control Chart Limits ( 3 sigma) for this problem. A process at Amit Eynan Botting Company that is considered in control measures liquid in ounces. Below are the last 12 sarnples taken. The sarnple size =4. 2) What are the control limits for the moan chart? UCLx=20.15 ounces (round your response to two decimat places). LClx=19.65 ounces (round your response to Wo decimal places). a) Whal are the control limits for the mean chart? UCLx=20.15 ounces (round your response to two decimal places) LCLx=19.65 ounces (round your response to two decimal places). Choose the correct graph of the sample data for the x-chart. Choose the correct graph of the sample data for the x-chart b) What are the control limits for the range chart? UCLR2= ounces (round your response to two decimal places). Data Table
Step by Step Solution
There are 3 Steps involved in it

Get step-by-step solutions from verified subject matter experts