

Question: Calculate all values for this problem by hand. Use Control Chart Factors Table below A . Specify the properties necessary to create an R chart:
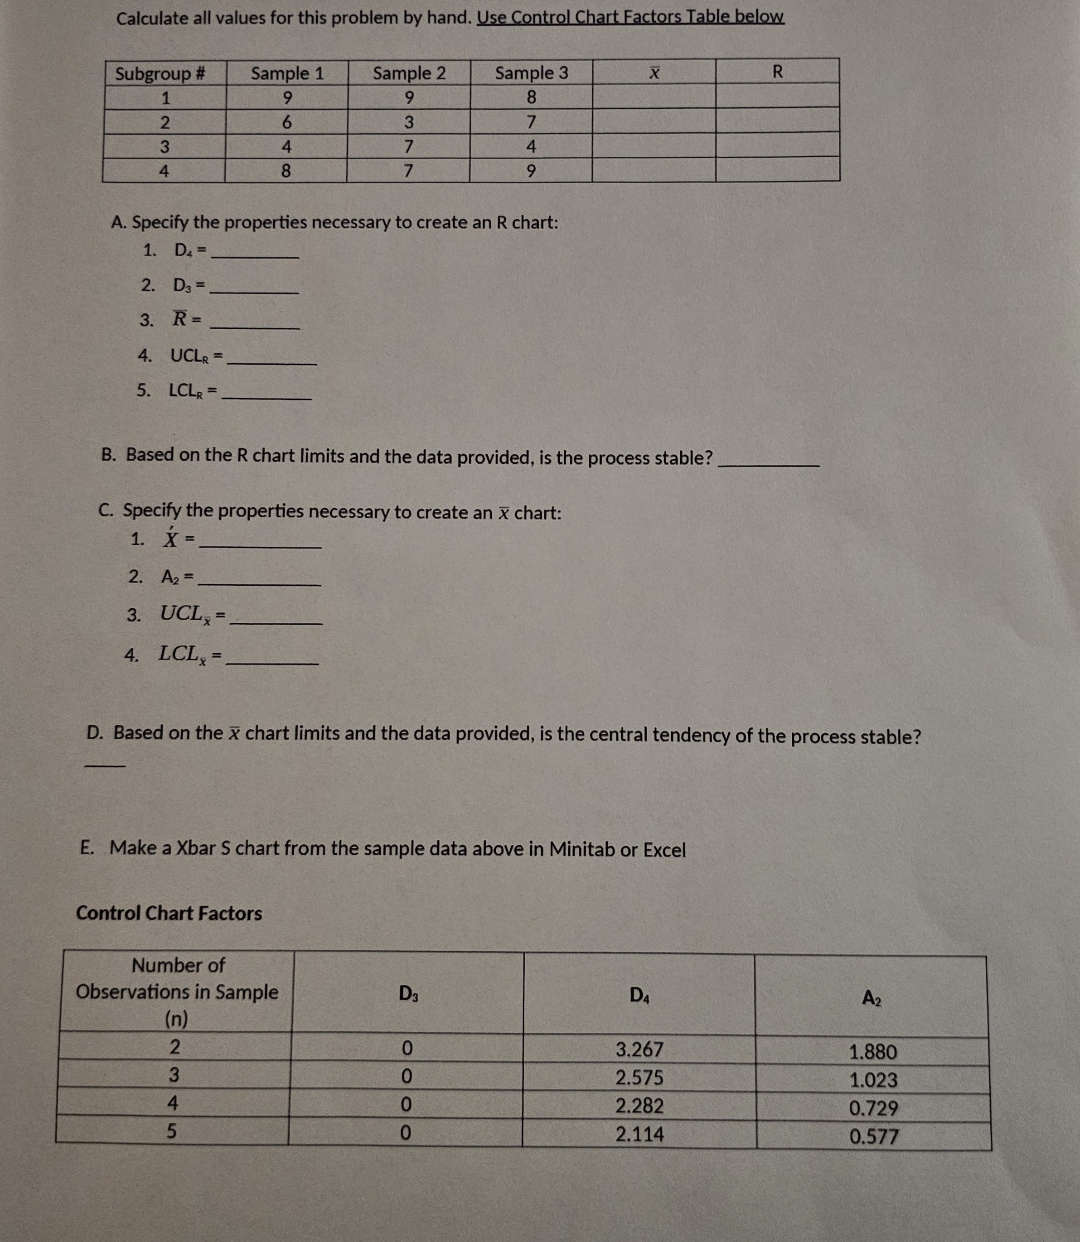
Calculate all values for this problem by hand. Use Control Chart Factors Table below
A Specify the properties necessary to create an R chart:
B Based on the R chart limits and the data provided, is the process stable?
C Specify the properties necessary to create an chart:
D Based on the chart limits and the data provided, is the central tendency of the process stable?
E Make a Xbar S chart from the sample data above in Minitab or Excel
Control Chart Factors
Step by Step Solution
There are 3 Steps involved in it
1 Expert Approved Answer
Step: 1 Unlock

Question Has Been Solved by an Expert!
Get step-by-step solutions from verified subject matter experts
Step: 2 Unlock
Step: 3 Unlock