

Question: Calculate control limit (x bar, r chart, capability index, create a control chart, calculate the percentage of units that are expected to be out of
Calculate control limit (x bar, r chart, capability index, create a control chart, calculate the percentage of units that are expected to be out of spec(z-value)
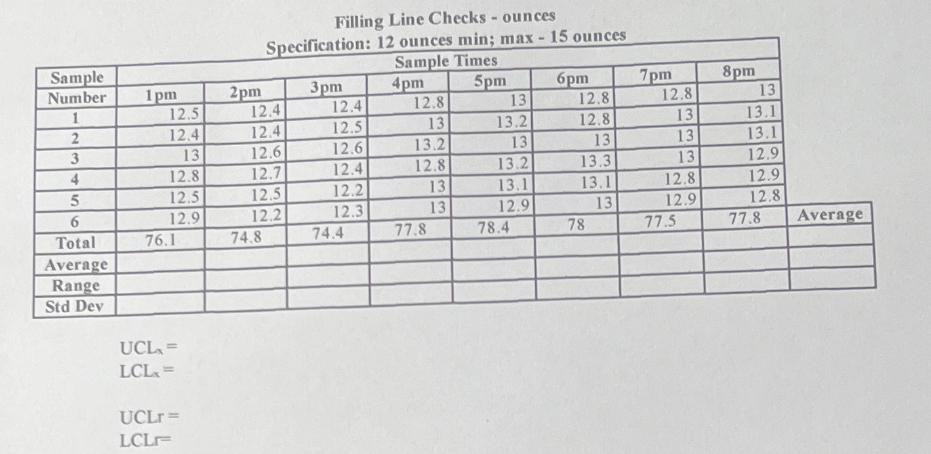
Sample Number 1 2 3 4 5 6 Total Average Range Std Dev 1pm 12.5 12.4 13 12.8 12.5 12.9 76.1 UCL = LCL = UCLr= LCL- 2pm Filling Line Checks - ounces Specification: 12 ounces min; max-15 ounces Sample Times 4pm 5pm 12.4 12.4 12.6 12.7 12.5 12.2 74.8 3pm 12.4 12.5 12.6 12.4 12.2 12.3 74.4 12.8 13 13.2 12.8 13 13 77.8 13 13.2 13 13.2 13.1 12.9 78.4 6pm 12.8 12.8 13 13.3 13.1 13 78 7pm 12.8 13 13 13 12.8 12.9 77.5 8pm 13 13.1 13.1 12.9 12.9 12.8 77.8 Average
Step by Step Solution
3.37 Rating (153 Votes )
There are 3 Steps involved in it
Solution Here are the steps to solve this problem 1 Calculate the average and range for each sample Sample 1 Average 126 Range 8 Sample 2 Average 127 ... View full answer

Get step-by-step solutions from verified subject matter experts