

Question: Using the data provided calculate: x-bar and r-chart capability index create a control chart calculate the percentage of units that are expected to be out
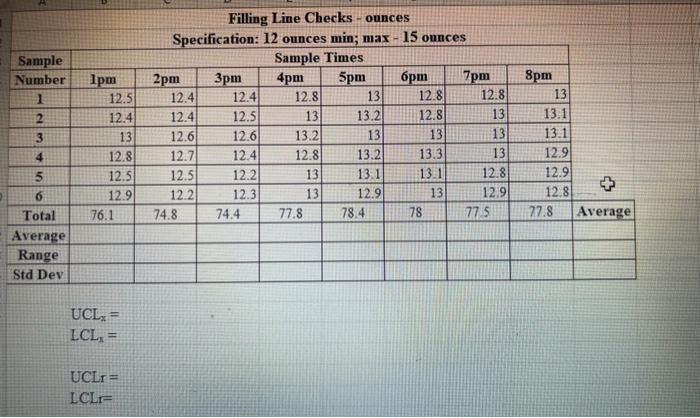
Filling Line Checks - ounces Specification: 12 ounces min; max - 15 ounces \begin{tabular}{|c|c|c|c|c|c|c|c|c|c|} \hline \multirow{2}{*}{\begin{tabular}{l} Sample \\ Number \end{tabular}} & \multicolumn{8}{|c|}{ Sample Times } & \\ \hline & 1pm & 2pm & 3pm & 4pm & 5pm & 6pm & 7pm & 8pm & \\ \hline 1 & 12.5 & 12.4 & 12.4 & 12.8 & 13 & 12.8 & 12.8 & 13 & \\ \hline 2 & 12.4 & 12.4 & 12.5 & 13 & 13.2 & 12.8 & 13 & 13.1 & \\ \hline 3 & 13 & 12.6 & 12.6 & 13.2 & 13 & 13 & 13 & 13.1 & \\ \hline 4 & 12.8 & 12.7 & 12.4 & 12.8 & 13.2 & 13.3 & 13 & 12.9 & \\ \hline 5 & 12.5 & 12.5 & 12.2 & 13 & 13.1 & 131 & 12.8 & 12.9 & \\ \hline 6 & 12.9 & 12.2 & 12.3 & 13 & 12.9 & 13 & 12.9 & 12.8 & 53 \\ \hline Total & 76.1 & 74.8 & 74.4 & 77.8 & 78.4 & 78 & 77.5 & 77.8 & Average \\ \hline \multicolumn{10}{|l|}{ Average } \\ \hline \multicolumn{10}{|l|}{ Range } \\ \hline Std Dev & & & & & & & & & \\ \hline \end{tabular} UCLx=LCLx= UCLr= LCLr=
Step by Step Solution
There are 3 Steps involved in it

Get step-by-step solutions from verified subject matter experts