

Question: Calculate, Draw and Label: Below is the actual data for a publicly traded stock. Using a standard deviation curve, what percent of the time does
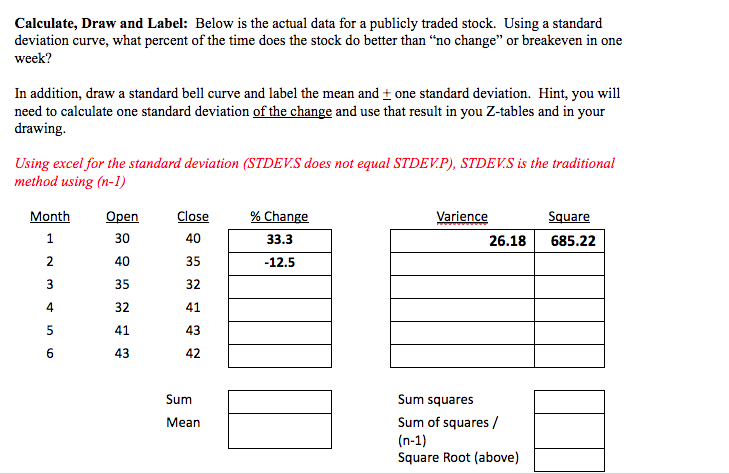
Calculate, Draw and Label: Below is the actual data for a publicly traded stock. Using a standard deviation curve, what percent of the time does the stock do better than "no change" or breakeven in one week? In addition, draw a standard bell curve and label the mean and t one standard deviation. Hint, you will need to calculate one standard deviation of the change and use that result in you Z-tables and in your drawing Using excel for the standard deviation (STDEV.S does not equal STDEVP), STDEV.S is the traditional method using (n-I) Month Open Close %Change Varience Square 30 40 35 32 41 43 40 35 32 41 43 42 33.3 26.18 685.22 12.5 4 6 Sum squares Sum of squares / (n-1) Square Root (above) Sum Mean
Step by Step Solution
There are 3 Steps involved in it

Get step-by-step solutions from verified subject matter experts