

Question: Calculate ratios for year 2017 and 2018 -operating margin ratio -return on sales -current ratio Income Statement Revenue Total Revenue Cost of Revenue Gross Profit
Calculate ratios for year 2017 and 2018
-operating margin ratio
-return on sales
-current ratio
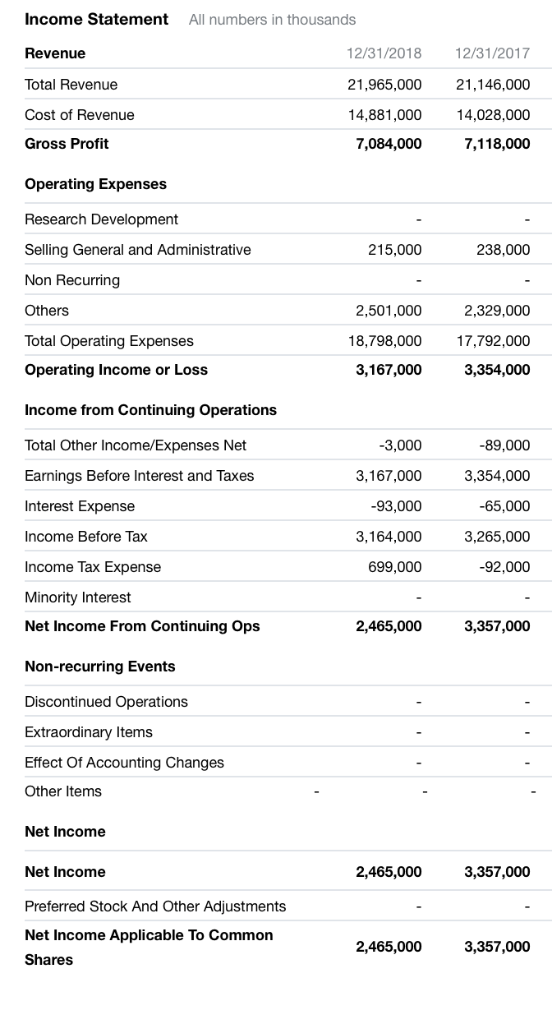
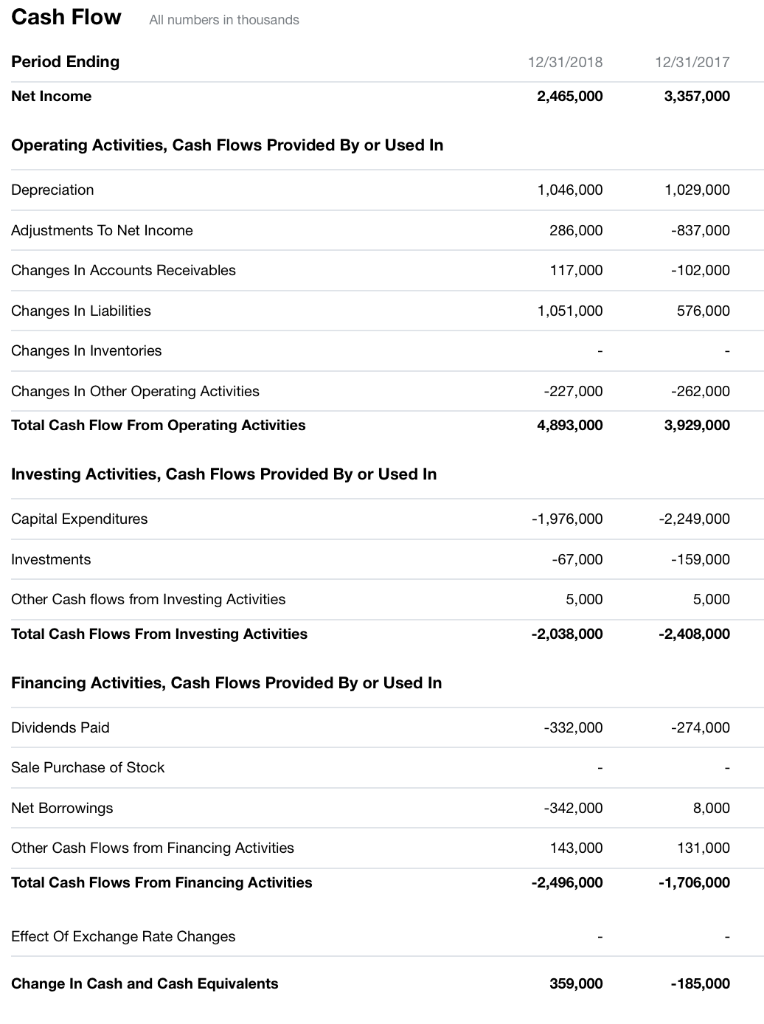
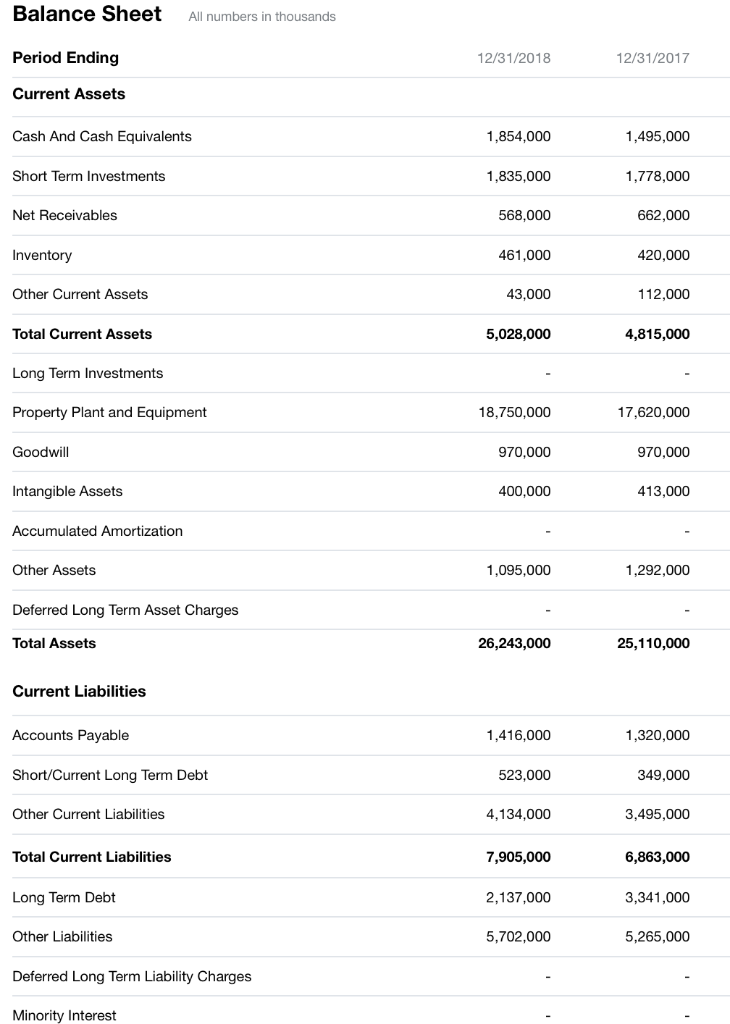
Income Statement Revenue Total Revenue Cost of Revenue Gross Profit All numbers in thousands 12/31/2018 12/31/2017 21,965,000 21,146,000 14,881,000 14,028,000 7,118,000 7,084,000 Operating Expenses Research Development Selling General and Administrative Non Recurring Others Total Operating Expenses Operating Income or Loss Income from Continuing Operations Total Other Income/Expenses Net Earnings Before Interest and Taxes Interest Expense Income Before Tax Income Tax Expense Minority Interest Net Income From Continuing Ops Non-recurring Events Discontinued Operations Extraordinary Items Effect Of Accounting Changes Other Items 215,000 238,000 2,329,000 18,798,000 17,792,000 3,354,000 2,501,000 3,167,000 3,000 3,167,000 93,000 3,164,000 699,000 -89,000 3,354,000 65,000 3,265,000 92,000 2,465,000 3,357,000 Net Income Net Income Preferred Stock And Other Adjustments Net Income Applicable To Common Shares 2,465,000 3,357,000 2,465,000 3,357,000 Cash Flow All numbers in thousands Period Ending 12/31/2018 12/31/2017 Net Income 2,465,000 3,357,000 Operating Activities, Cash Flows Provided By or Used In Depreciation Adjustments To Net Income Changes In Accounts Receivables Changes In Liabilities Changes In Inventories Changes In Other Operating Activities Total Cash Flow From Operating Activities Investing Activities, Cash Flows Provided By or Used In Capital Expenditures 1,046,000 286,000 117,000 1,051,000 1,029,000 837,000 102,000 576,000 227,000 -262,000 4,893,000 3,929,000 1,976,000 -67,000 5,000 -2,038,000 2,249,000 159,000 5,000 2,408,000 Investments Other Cash flows from Investing Activities Total Cash Flows From Investing Activities Financing Activities, Cash Flows Provided By or Used In Dividends Paid Sale Purchase of Stock Net Borrowings Other Cash Flows from Financing Activities Total Cash Flows From Financing Activities 332,000 -274,000 342,000 143,000 -2,496,000 8,000 131,000 -1,706,000 Effect Of Exchange Rate Changes Change In Cash and Cash Equivalents 359,000 -185,000 Balance Sheet Period Ending Current Assets All numbers in thousands 12/31/2018 12/31/2017 1,854,000 1,835,000 568,000 461,000 43,000 5,028,000 1,495,000 1,778,000 662,000 420,000 112,000 4,815,000 Cash And Cash Equivalents Short Term Investments Net Receivables Inventory Other Current Assets Total Current Assets Long Term Investments Property Plant and Equipment Goodwill Intangible Assets Accumulated Amortization Other Assets 18,750,000 17,620,000 970,000 413,000 970,000 400,000 1,095,000 1,292,000 Deferred Long Term Asset Charges Total Assets 26,243,000 25,110,000 Current Liabilities Accounts Payable Short/Current Long Term Debt Other Current Liabilities 1,416,000 523,000 4,134,000 1,320,000 349,000 3,495,000 Total Current Liabilities 7,905,000 2,137,000 5,702,000 6,863,000 3,341,000 5,265,000 Long Term Debt Other Liabilities Deferred Long Term Liability Charges Minority Interest
Step by Step Solution
There are 3 Steps involved in it

Get step-by-step solutions from verified subject matter experts