

Question: Calculate the required return and the present value for both shares would you place on each share. Furthermore, assume that Sharp Ltds dividend has grown
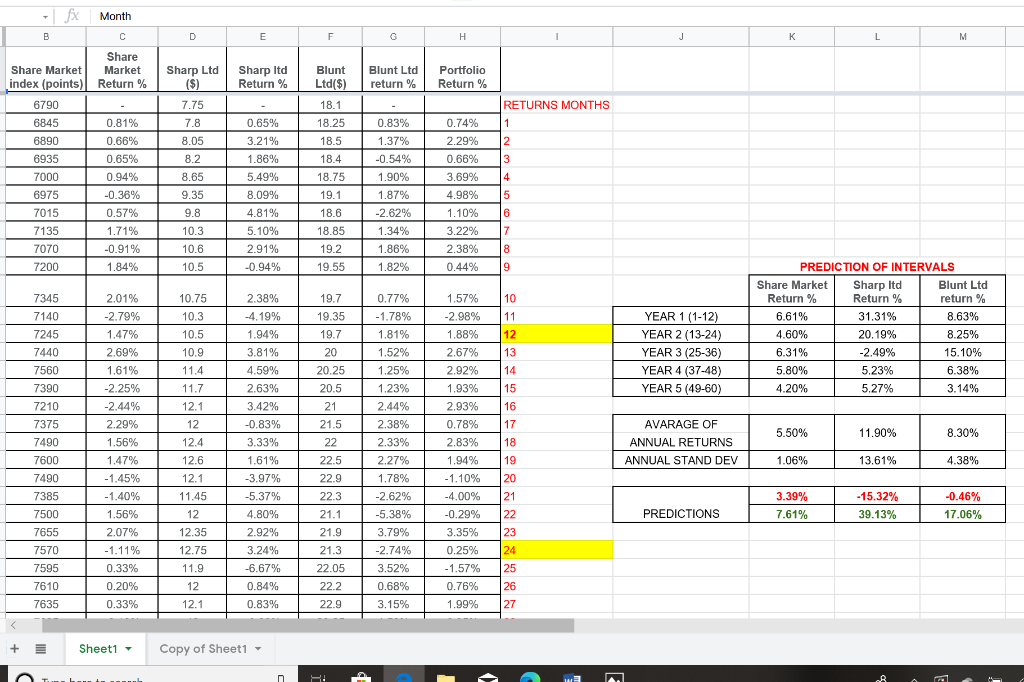 Calculate the required return and the present value for both shares would you place on each share. Furthermore, assume that Sharp Ltds dividend has grown from$0.50 to $0.58 in the last 5 years and Blunt Ltds dividend has increased from $1.10 to $1.34 over the last 5 years. The last observed 10-years government bond yield was 2%. What concerns does the research raise in regards to dividend valuation models?
- fx Month B D E F F G H J K L M Sharp Itd Return % Blunt Ltd($) Blunt Ltd return % Portfolio Return % RETURNS MONTHS 1 0.65% Share Share Market Market index (points) Return % 6790 6845 0.81% 6890 0.66% 6935 0.65% 7000 0.94% 6975 -0.36% 7015 0.57% 7135 1.71% 7070 -0.91% 7200 1.84% Sharp Ltd ($) 7.75 7.8 8.05 8.2 8.65 9.35 2 3 14 18.1 18.25 18.5 18.4 18.75 19.1 18.6 18.85 19.2 19.55 3.21% 1.86% 5.49% 8.09% 4.81% 5.10% 2.91% -0.94% 0.83% 1.37% -0.54% 1.90% 1.87% -2.62% 1.34% 1.86% 1.82% 0.74% 2.29% 0.66% 3.69% 4.98% 1.10% 3.22% 2.38% 0.44% 15 6 7 9.8 10.3 10.6 10.5 8 9 2.38% 19.7 10 11 19.35 19.7 20 20.25 12. PREDICTION OF INTERVALS Share Market Sharp Itd Blunt Ltd Return % Return % return % 6.61% 31.31% 8.63% 4.60% 20.19% 8.25% 6.31% -2.49% 15.10% 5.80% 5.23% 6.38% 4.20% 5.27% 3.14% YEAR 1 (1-12) YEAR 2 (13-24) YEAR 3 (25-36) YEAR 4 (37-48) YEAR 5 (49-60) 13 14 20.5 15 16 17 5.50% 11.90% 8.30% 18 7345 7140 7245 7440 7560 7390 7210 7375 7490 7600 7490 7385 7500 7655 7570 7595 7610 7635 2.01% -2.79% 1.47% 2.69% 1.61% -2.25% -2.44% 2.29% 1.56% 1.47% -1.45% -1.40% 1.56% 2.07% -1.11% 0.33% 0.20% % 0.33% 10.75 10.3 10.5 10.9 11.4 11.7 12.1 12 12.4 12.6 12.1 11.45 12 12.35 12.75 11.9 12 12.1 -4.19% 1.94% 3.81% 4.59% 2.63% 3.42% -0.83% 3.33% 1.61% -3.97% -5.37% 4.80% 2.92% 3.24% -6.67% 0.84% 0.83% 0.77% -1.78% 1.81% 1.52% 1.25% 1.23% 2.44% 2.38% 2.33% 2.27% 1.78% -2.62% -5.38% 3.79% -2.74% 3.52% 0.68% 3.15% 1.57% -2.98% 1.88% 2.67% 2.92% 1.93% 2.93% 0.78% 2.83% 1.94% -1.10% -4.00% -0.29% 3.35% 0.25% -1.57% 0.76% 1.99% AVARAGE OF ANNUAL RETURNS ANNUAL STAND DEV 1.06% 21 21.5 22 22.5 22.9 22.3 21.1 21.9 21.3 22.05 22.2 22.9 13.61% 4.38% 19 20 21 22 23 3.39% 7.61% -15.32% 39.13% -0.46% 17.06% PREDICTIONS 24 25 26 27 + Sheet1 Copy of Sheet1 - PA WE
Step by Step Solution
There are 3 Steps involved in it

Get step-by-step solutions from verified subject matter experts