

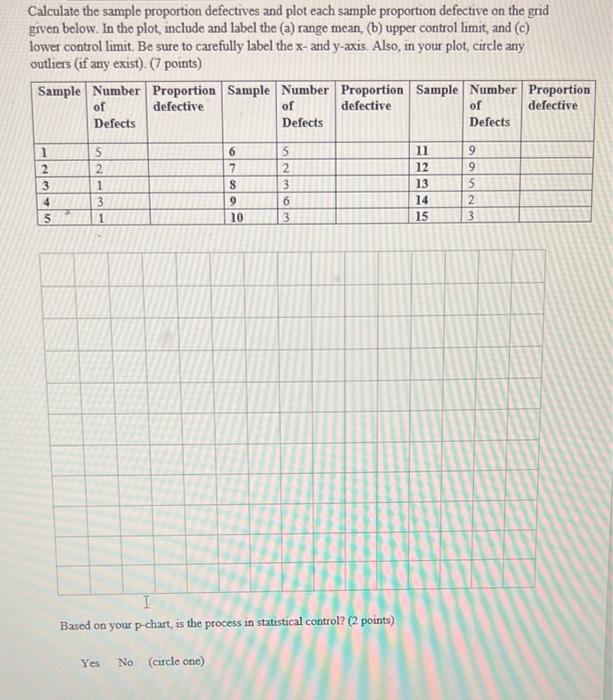
Question: Calculate the sample proportion defectives and plot each sample proportion defective on the grid given below. In the plot, include and label the (a) range
Step by Step Solution
There are 3 Steps involved in it
1 Expert Approved Answer
Step: 1 Unlock

Question Has Been Solved by an Expert!
Get step-by-step solutions from verified subject matter experts
Step: 2 Unlock
Step: 3 Unlock