

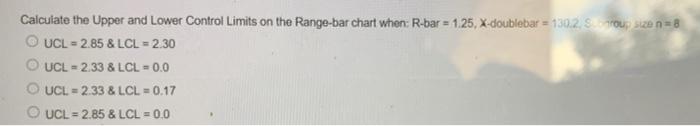
Question: Calculate the Upper and Lower Control Limits on the Range-bar chart when: R-bar = 1.25, X-doublebar = 1302. Sa, roup size n=8 UCL = 2.85
Step by Step Solution
There are 3 Steps involved in it
1 Expert Approved Answer
Step: 1 Unlock

Question Has Been Solved by an Expert!
Get step-by-step solutions from verified subject matter experts
Step: 2 Unlock
Step: 3 Unlock