

Question: Calculate the various yield ratios and put in the table provided Appendix L. Reliability and Validity Data Number 1 Performance 2 2 4 3 5
Calculate the various yield ratios and put in the table provided
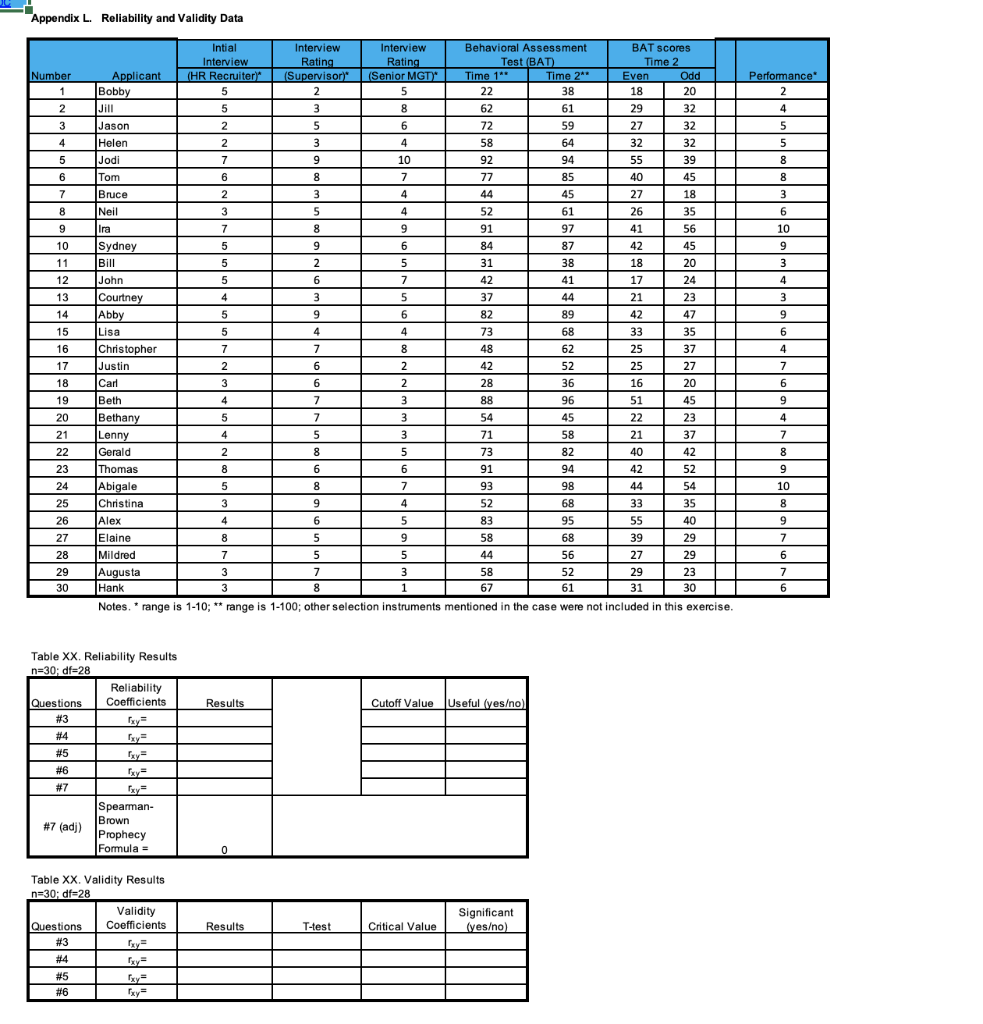
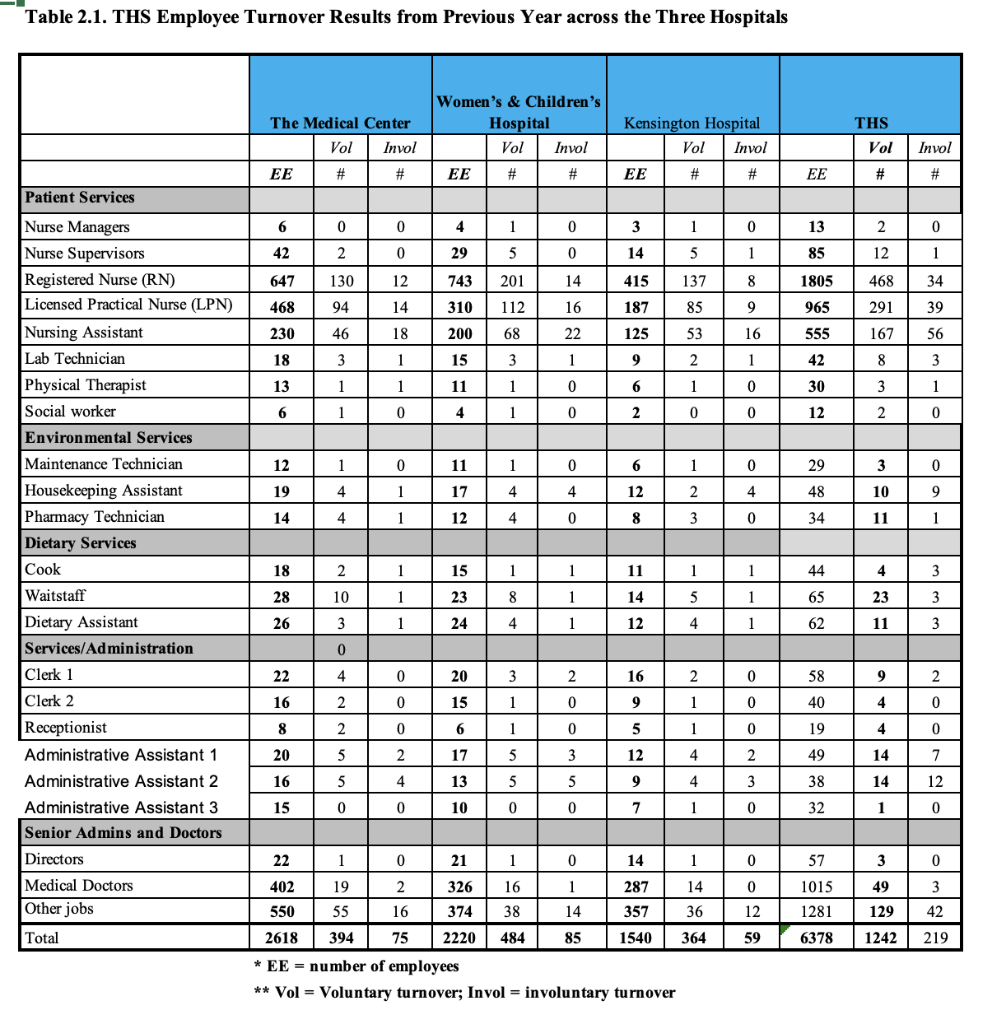
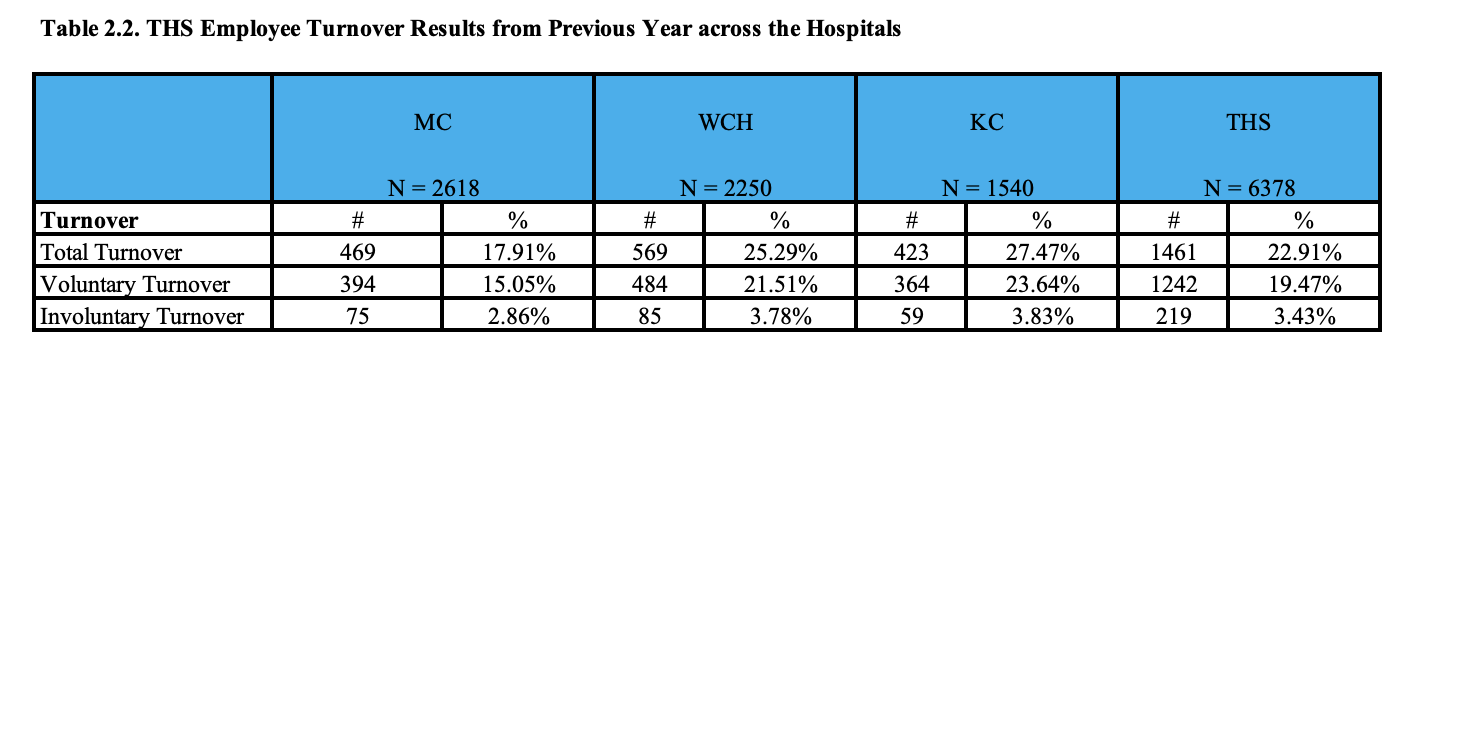
Appendix L. Reliability and Validity Data Number 1 Performance 2 2 4 3 5 5 4 5 6 7 8 9 8 8 3 6 10 9 3 10 11 12 13 4 3 9 14 15 Intial Interview Interview Behavioral Assessment BAT scores Interview Rating Rating Test (BAD Time 2 Applicant (HR Recruiter (Supervisor (Senior MGT" Time 1 Time 2** Even Odd Bobby 5 2 5 22 38 18 20 Jill 5 3 8 62 61 29 32 Jason 2 5 6 72 59 27 32 Helen 2 3 4 4 58 64 32 32 Jodi 7 9 10 92 94 55 39 Tom 6 8 7 77 85 40 45 Bruce 2 3 4 44 45 27 18 Neil 3 5 4 52 61 26 35 Ira 7 8 9 91 97 41 56 Sydney 5 9 6 84 87 42 45 Bill 5 2 5 31 38 18 20 John 5 6 6 7 42 41 17 24 Courtney 4 3 5 37 44 21 23 Abby 5 9 9 6 82 89 42 47 Lisa 5 4 4 73 68 33 35 Christopher 7 7 7 8 48 62 25 37 Justin 2 6 2 42 52 25 27 Carl 3 6 2 28 36 16 20 Beth 4 7 3 88 96 51 45 5 7 3 54 45 22 23 Lenny 4 5 3 71 58 21 37 Gerald 2 8 5 73 82 40 42 Thomas 8 6 6 91 94 42 52 Abigale 5 8 7 93 98 44 54 Christina 3 9 9 4 52 68 33 35 Alex 4 6 5 83 95 55 40 Elaine 8 5 9 58 68 39 29 Mildred 7 5 5 44 56 27 29 Augusta 3 7 3 58 52 29 23 Hank 3 8 1 67 61 31 30 Notes. * range is 1-10; ** range is 1-100; other selection instruments mentioned in the case were not included in this exercise. 6 16 17 18 19 Bethany 20 21 22 23 24 25 4 7 7 6 9 4 7 8 9 9 10 8 9 7 26 27 28 29 6 7 6 30 Results Cutoff Value Useful (yeso) Table XX. Reliability Results n=30; df=28 Reliability Questions Coefficients #3 #4 #5 #6 #7 #7 (adj) Spearman- Brown Prophecy Formula = 0 Table XX. Validity Results n=30: df=28 Validity Questions Coefficients #3 Results Significant (yeso) T-test Critical Value #5 #6 Table 2.1. THS Employee Turnover Results from Previous Year across the Three Hospitals THS The Medical Center Vol Invol Women's & Children's Hospital Vol Invol EE # # Kensington Hospital Vol Invol Vol Invol # EE # # EE # EE # # Patient Services 6 0 0 4 0 3 1 0 13 2 0 1 5 42 0 0 14 5 1 85 12 1 1 647 2 130 94 12 29 743 310 201 14 137 8 1805 468 34 415 187 468 14 112 16 85 9 965 291 39 230 46 18 200 68 22 125 53 16 555 167 56 18 3 1 15 3 1 1 9 2 1 42 8 3 13 1 1 1 0 6 1 0 30 3 1 11 4 6 1 0 1 0 0 NI 2 0 12 2 0 12 1 0 11 1 0 6 1 0 29 3 0 + 19 4 1 17 4 4 12 2 4 48 10 9 14 4 1 12 4 0 8 3 0 34 11 1 Nurse Managers Nurse Supervisors Registered Nurse (RN) Licensed Practical Nurse (LPN) Nursing Assistant Lab Technician Physical Therapist Social worker Environmental Services Maintenance Technician Housekeeping Assistant Pharmacy Technician Dietary Services Cook Waitstaff Dietary Assistant Services/Administration Clerk 1 Clerk 2 Receptionist Administrative Assistant 1 Administrative Assistant 2 Administrative Assistant 3 Senior Admins and Doctors Directors 18 2 1 15 1 1 11 1 1 44 4 3 28 10 1 23 8 1 14 5 23 1 1 65 62 3 3 26 3 1 24 4 1 12 4 11 0 22 0 20 3 2 16 2 0 58 al 9 2 4 2 0 15 1 0 9 1 0 40 4 0 16 8 2 0 6 1 0 5 1 0 19 4 0 20 5 2 17 3 12 4 2 49 14 5 5 7 12 16 5 4 13 5 9 4 3 38 14 15 0 0 10 0 0 7 1 0 32 1 0 0 57 3 0 0 1015 49 Medical Doctors Other jobs 3 42 12 1281 129 Total 22 1 0 21 1 0 14 1 402 19 2 326 16 1 287 14 550 55 16 374 38 14 357 36 2618 394 75 2220 484 85 1540 364 * EE = number of employees ** Vol = Voluntary turnover; Invol = involuntary turnover 59 6378 1242 219 Table 2.2. THS Employee Turnover Results from Previous Year across the Hospitals MC WCH KC THS Turnover Total Turnover Voluntary Turnover Involuntary Turnover N= 2618 # % 469 17.91% 394 15.05% 75 2.86% N= 2250 # % 569 25.29% 484 21.51% 85 3.78% N= 1540 # % 423 27.47% 364 23.64% 59 3.83% N = 6378 # % 1461 22.91% 1242 19.47% 219 3.43% Appendix L. Reliability and Validity Data Number 1 Performance 2 2 4 3 5 5 4 5 6 7 8 9 8 8 3 6 10 9 3 10 11 12 13 4 3 9 14 15 Intial Interview Interview Behavioral Assessment BAT scores Interview Rating Rating Test (BAD Time 2 Applicant (HR Recruiter (Supervisor (Senior MGT" Time 1 Time 2** Even Odd Bobby 5 2 5 22 38 18 20 Jill 5 3 8 62 61 29 32 Jason 2 5 6 72 59 27 32 Helen 2 3 4 4 58 64 32 32 Jodi 7 9 10 92 94 55 39 Tom 6 8 7 77 85 40 45 Bruce 2 3 4 44 45 27 18 Neil 3 5 4 52 61 26 35 Ira 7 8 9 91 97 41 56 Sydney 5 9 6 84 87 42 45 Bill 5 2 5 31 38 18 20 John 5 6 6 7 42 41 17 24 Courtney 4 3 5 37 44 21 23 Abby 5 9 9 6 82 89 42 47 Lisa 5 4 4 73 68 33 35 Christopher 7 7 7 8 48 62 25 37 Justin 2 6 2 42 52 25 27 Carl 3 6 2 28 36 16 20 Beth 4 7 3 88 96 51 45 5 7 3 54 45 22 23 Lenny 4 5 3 71 58 21 37 Gerald 2 8 5 73 82 40 42 Thomas 8 6 6 91 94 42 52 Abigale 5 8 7 93 98 44 54 Christina 3 9 9 4 52 68 33 35 Alex 4 6 5 83 95 55 40 Elaine 8 5 9 58 68 39 29 Mildred 7 5 5 44 56 27 29 Augusta 3 7 3 58 52 29 23 Hank 3 8 1 67 61 31 30 Notes. * range is 1-10; ** range is 1-100; other selection instruments mentioned in the case were not included in this exercise. 6 16 17 18 19 Bethany 20 21 22 23 24 25 4 7 7 6 9 4 7 8 9 9 10 8 9 7 26 27 28 29 6 7 6 30 Results Cutoff Value Useful (yeso) Table XX. Reliability Results n=30; df=28 Reliability Questions Coefficients #3 #4 #5 #6 #7 #7 (adj) Spearman- Brown Prophecy Formula = 0 Table XX. Validity Results n=30: df=28 Validity Questions Coefficients #3 Results Significant (yeso) T-test Critical Value #5 #6 Table 2.1. THS Employee Turnover Results from Previous Year across the Three Hospitals THS The Medical Center Vol Invol Women's & Children's Hospital Vol Invol EE # # Kensington Hospital Vol Invol Vol Invol # EE # # EE # EE # # Patient Services 6 0 0 4 0 3 1 0 13 2 0 1 5 42 0 0 14 5 1 85 12 1 1 647 2 130 94 12 29 743 310 201 14 137 8 1805 468 34 415 187 468 14 112 16 85 9 965 291 39 230 46 18 200 68 22 125 53 16 555 167 56 18 3 1 15 3 1 1 9 2 1 42 8 3 13 1 1 1 0 6 1 0 30 3 1 11 4 6 1 0 1 0 0 NI 2 0 12 2 0 12 1 0 11 1 0 6 1 0 29 3 0 + 19 4 1 17 4 4 12 2 4 48 10 9 14 4 1 12 4 0 8 3 0 34 11 1 Nurse Managers Nurse Supervisors Registered Nurse (RN) Licensed Practical Nurse (LPN) Nursing Assistant Lab Technician Physical Therapist Social worker Environmental Services Maintenance Technician Housekeeping Assistant Pharmacy Technician Dietary Services Cook Waitstaff Dietary Assistant Services/Administration Clerk 1 Clerk 2 Receptionist Administrative Assistant 1 Administrative Assistant 2 Administrative Assistant 3 Senior Admins and Doctors Directors 18 2 1 15 1 1 11 1 1 44 4 3 28 10 1 23 8 1 14 5 23 1 1 65 62 3 3 26 3 1 24 4 1 12 4 11 0 22 0 20 3 2 16 2 0 58 al 9 2 4 2 0 15 1 0 9 1 0 40 4 0 16 8 2 0 6 1 0 5 1 0 19 4 0 20 5 2 17 3 12 4 2 49 14 5 5 7 12 16 5 4 13 5 9 4 3 38 14 15 0 0 10 0 0 7 1 0 32 1 0 0 57 3 0 0 1015 49 Medical Doctors Other jobs 3 42 12 1281 129 Total 22 1 0 21 1 0 14 1 402 19 2 326 16 1 287 14 550 55 16 374 38 14 357 36 2618 394 75 2220 484 85 1540 364 * EE = number of employees ** Vol = Voluntary turnover; Invol = involuntary turnover 59 6378 1242 219 Table 2.2. THS Employee Turnover Results from Previous Year across the Hospitals MC WCH KC THS Turnover Total Turnover Voluntary Turnover Involuntary Turnover N= 2618 # % 469 17.91% 394 15.05% 75 2.86% N= 2250 # % 569 25.29% 484 21.51% 85 3.78% N= 1540 # % 423 27.47% 364 23.64% 59 3.83% N = 6378 # % 1461 22.91% 1242 19.47% 219 3.43%
Step by Step Solution
There are 3 Steps involved in it

Get step-by-step solutions from verified subject matter experts