

Question: CALCULATOR PRINTER VERSION Suppose selected financial data of Target and Wal-Mart for 2017 are presented here (in millions). Wal-Mart Target Corporation Inc. Income Statement Data
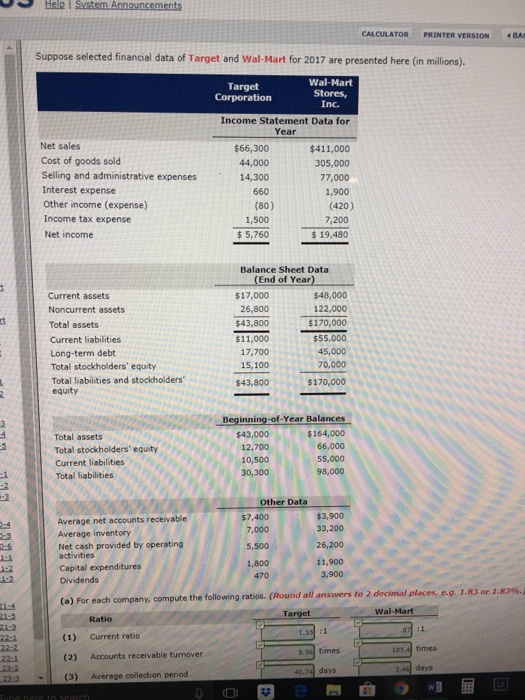
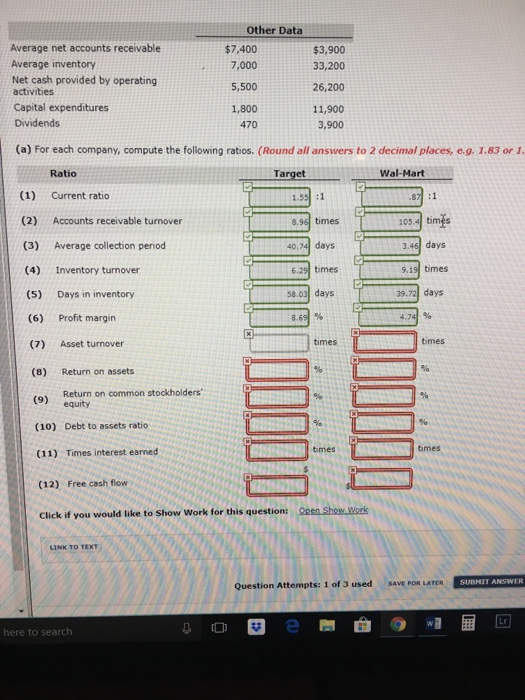
CALCULATOR PRINTER VERSION Suppose selected financial data of Target and Wal-Mart for 2017 are presented here (in millions). Wal-Mart Target Corporation Inc. Income Statement Data for Year Net sales Cost of goods sold Selling and administrative expenses Interest expense Other income (expense) Income tax expense Net income $66,300 44,000 14,300 660 (80) 1,500 s 5,760 $411,000 305,000 77,000 1,900 (420) 7,200 $ 19,480 Balance Sheet Data End of Year) Current assets Noncurrent assets Total assets Current liabilities Long-term debt Total stockholders' equity Total liabilities and stockholders equity $17,000 26,800 $43,800 $11,000 17,700 15,100 $43,800 $48,000 122,000 $170,000 $55,000 45,000 70,000 $170,000 Total assets Total stockholders equity Current liabilities Total liabilities Beginning-of-Year Balances $164,000 66,000 55,000 98,000 $43,000 12,700 10,500 30,300 Other Data $7,400 7,000 5,500 1,800 $3,900 33,200 26,200 11,900 Average net accounts receivable Average inventory Net cash provided by operating activities Capital expenditures Dividends 3,900 eg, 1.83 or 1.83%. (a) For each company, compute the following ratios. (Round all answers to 2 decimial places Target Wal-Mart 21-5 1-2 Ratio (1) Current ratio 8.9 times 05.4 tmes (2) Accounts receivable turnover 22-1 22:2 0.74 days (3) Average collection period
Step by Step Solution
There are 3 Steps involved in it

Get step-by-step solutions from verified subject matter experts