

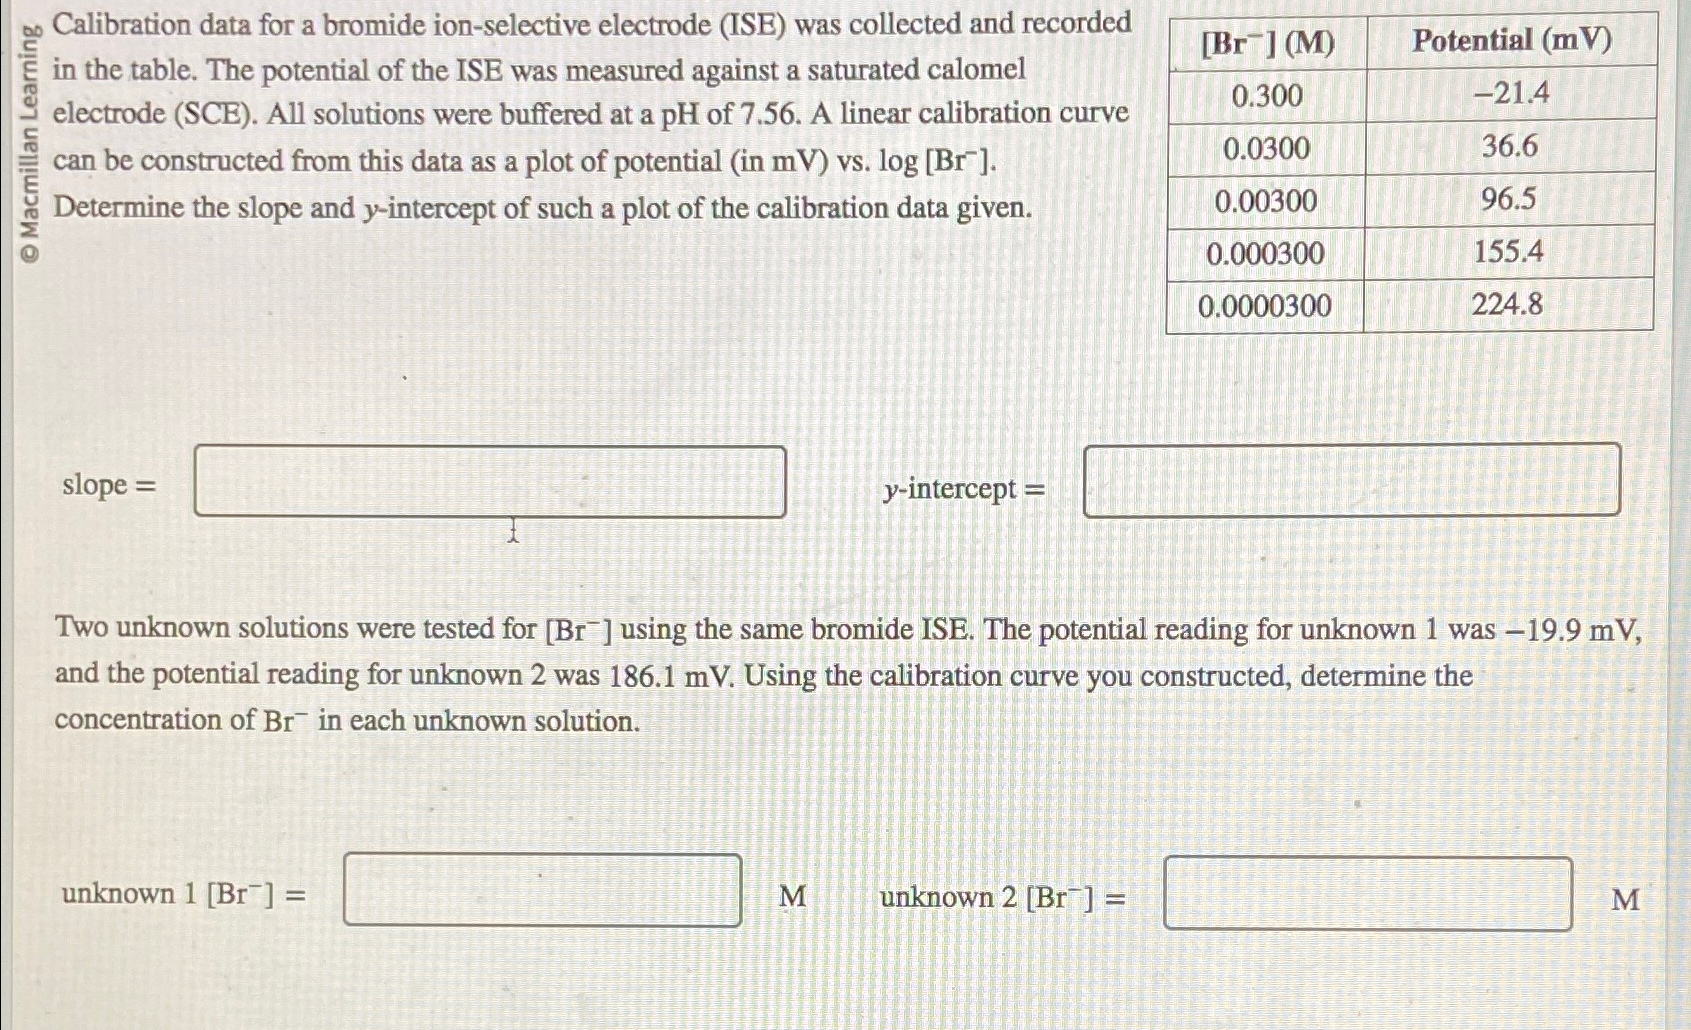
Question: Calibration data for a bromide ion - selective electrode ( ISE ) was collected and recorded in the table. The potential of the ISE was
Calibration data for a bromide ionselective electrode ISE was collected and recorded in the table. The potential of the ISE was measured against a saturated calomel electrode SCE All solutions were buffered at a of A linear calibration curve can be constructed from this data as a plot of potential in vs
Determine the slope and intercept of such a plot of the calibration data given.
tablePotential mV
slope
intercept
Two unknown solutions were tested for using the same bromide ISE. The potential reading for unknown was and the potential reading for unknown was Using the calibration curve you constructed, determine the concentration of in each unknown solution.
unknown
M
unknown
M
Step by Step Solution
There are 3 Steps involved in it
1 Expert Approved Answer
Step: 1 Unlock

Question Has Been Solved by an Expert!
Get step-by-step solutions from verified subject matter experts
Step: 2 Unlock
Step: 3 Unlock