

Question: Can I get help with c? The data in the table represent the ages of the winners of an award for the 36 50 past
Can I get help with c?
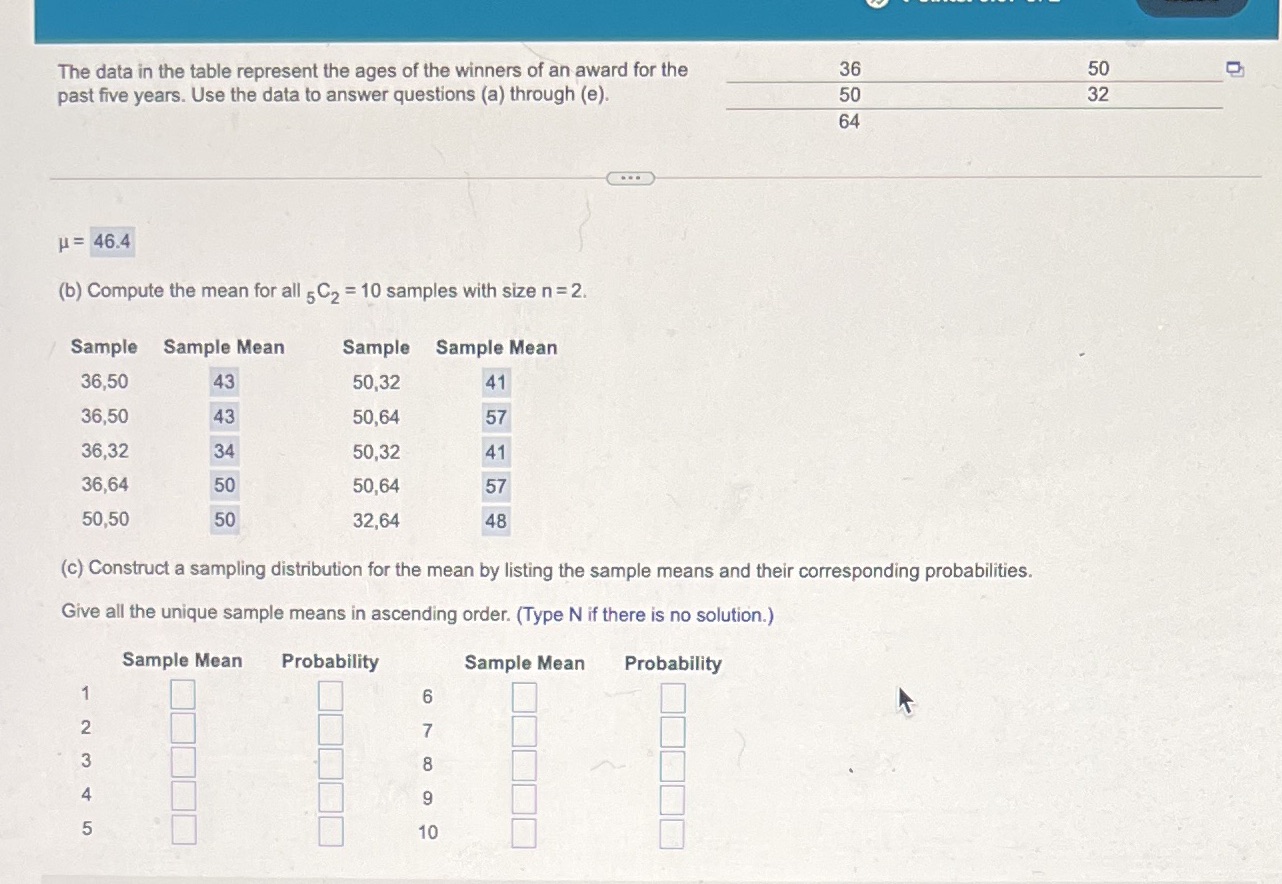
The data in the table represent the ages of the winners of an award for the 36 50 past five years. Use the data to answer questions (a) through (e). 50 32 64 H = 46.4 (b) Compute the mean for all 5 C2 = 10 samples with size n = 2. Sample Sample Mean Sample Sample Mean 36,50 43 50,32 41 36,50 43 50,64 57 36,32 34 50,32 41 36,64 50 50.64 57 50,50 50 32,64 48 (c) Construct a sampling distribution for the mean by listing the sample means and their corresponding probabilities. Give all the unique sample means in ascending order. (Type N if there is no solution.) Sample Mean Probability Sample Mean Probability 6 W N CO A 10
Step by Step Solution
There are 3 Steps involved in it

Get step-by-step solutions from verified subject matter experts