

Question: Can I please get help with this Matlab Project based on Computational Methods and Applications. Show the image of output too. Problem 1 Power iteration
Can I please get help with this Matlab Project based on Computational Methods and Applications. Show the image of output too.
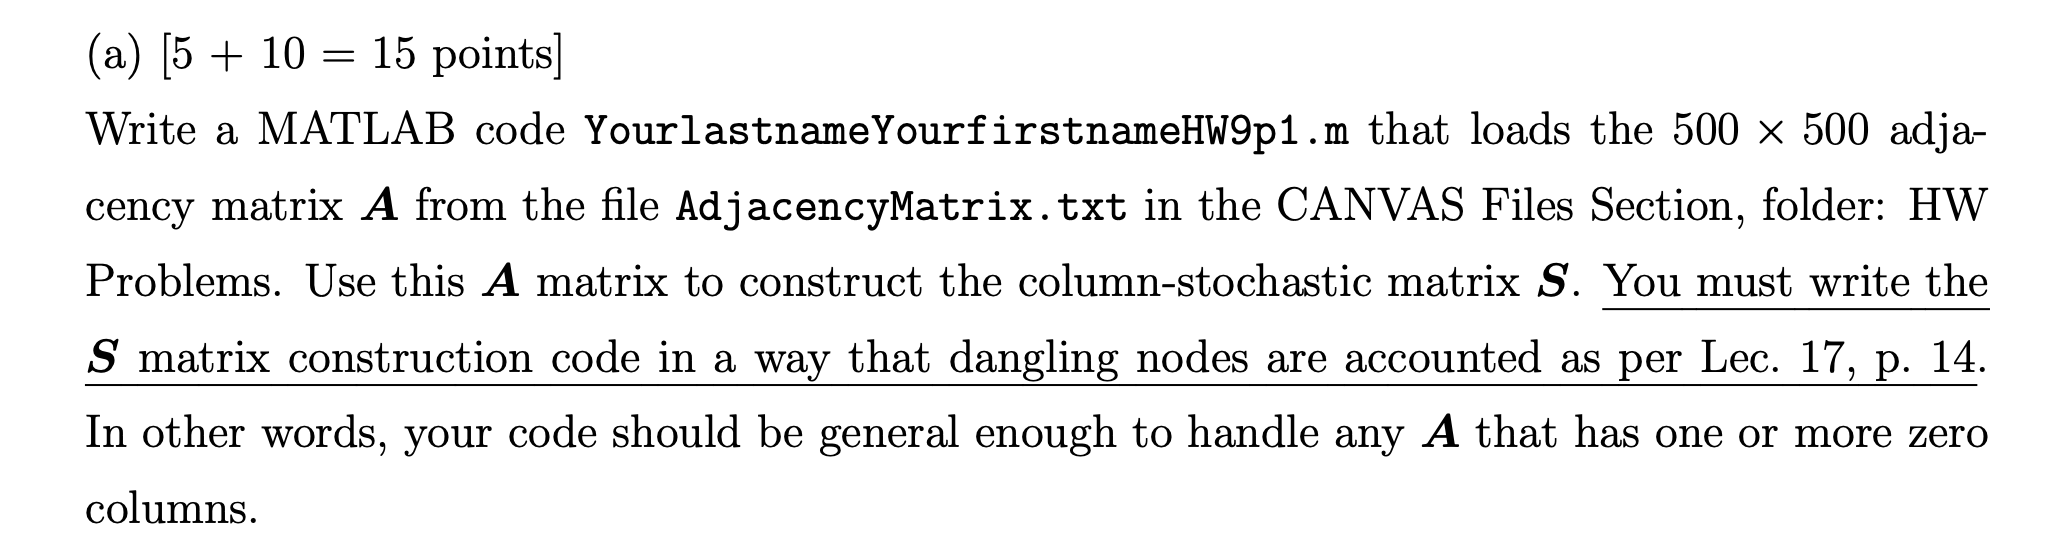
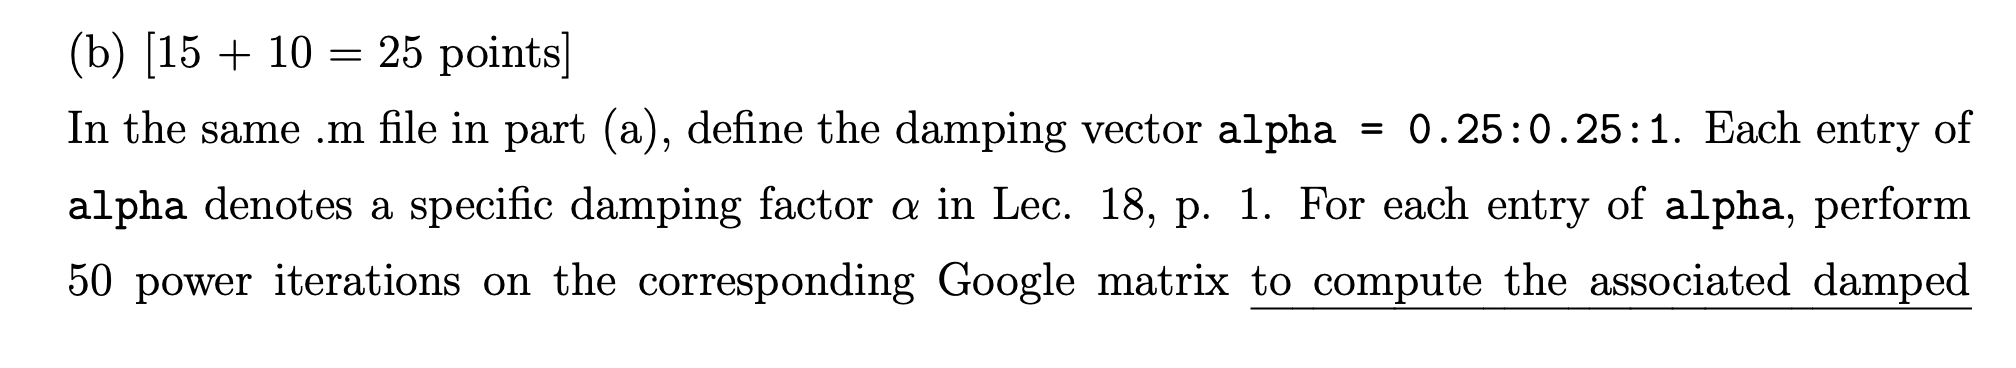
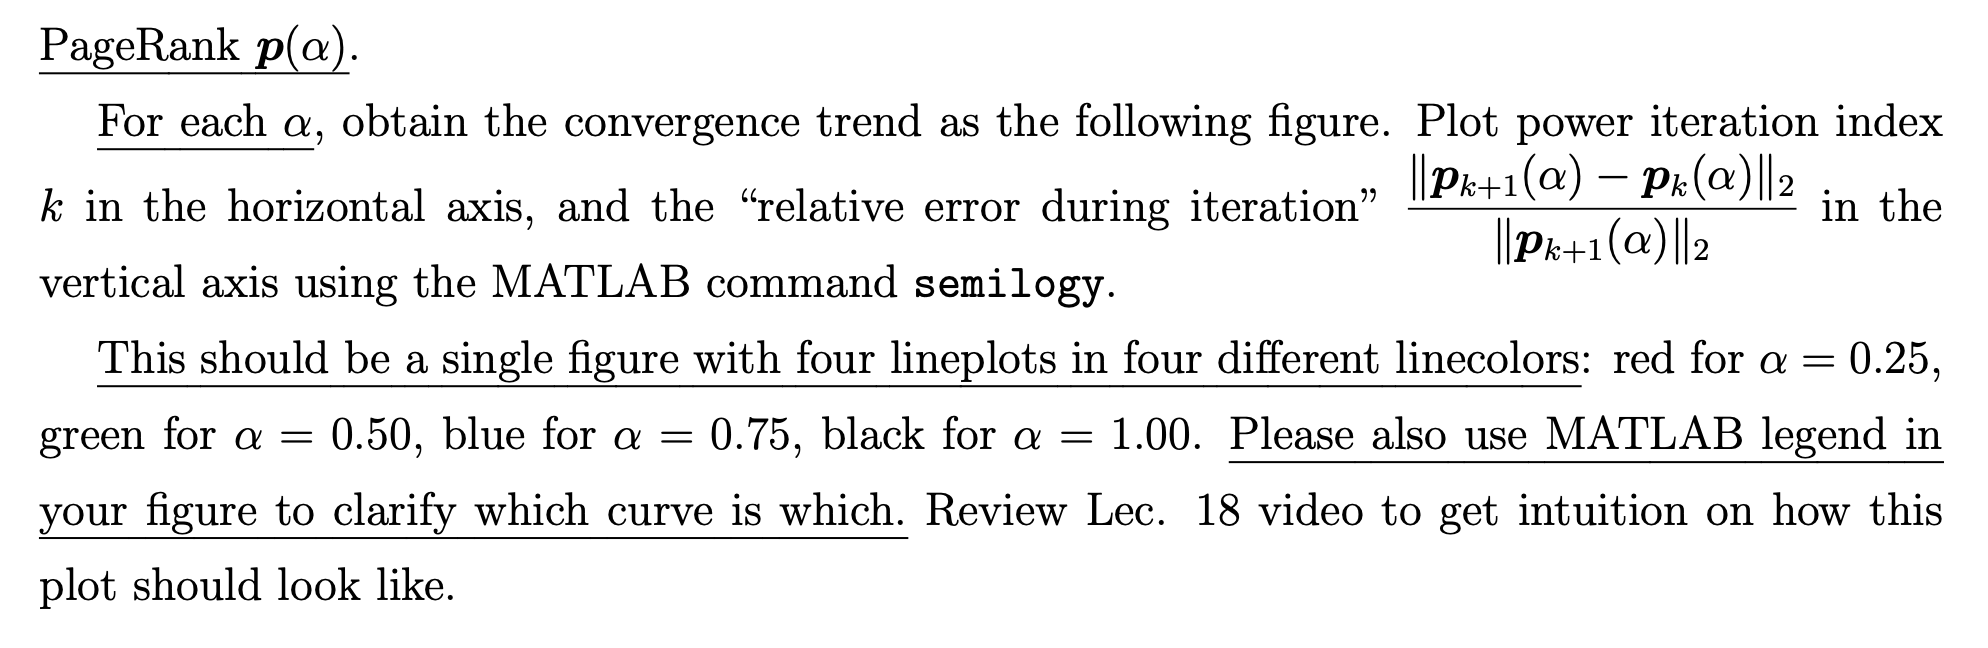
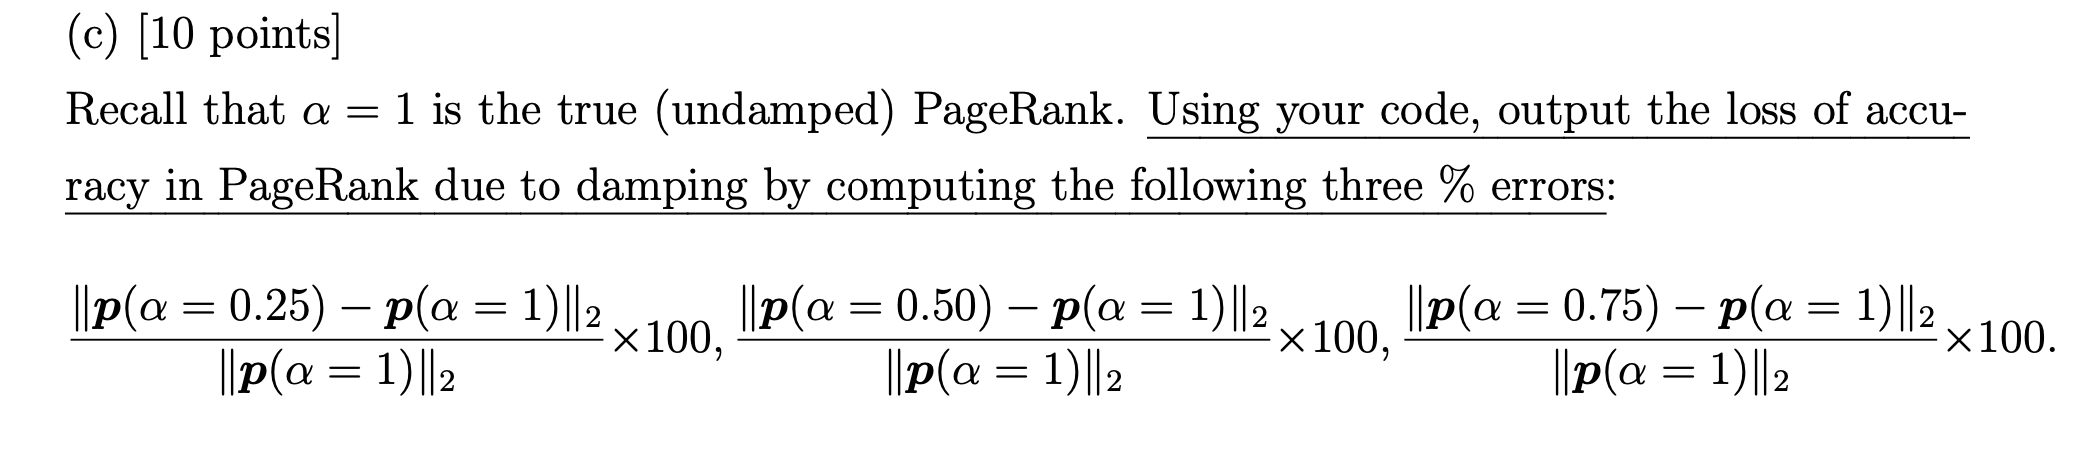
Problem 1 Power iteration to compute PageRank (50 points) We learnt in Lec. 17-18 that for a given Word Wide Web, or equivalently given its adjacency matrix A, the PageRank p is simply the dominant eigenvector of the corresponding Google matrix G (see Lec. 17, p. 9-16, and Lec. 18, p. 1-3). (a) [5 + 10 = 15 points) Write a MATLAB code Yourlastname YourfirstnameHW9p1.m that loads the 500 x 500 adja- cency matrix A from the file AdjacencyMatrix.txt in the CANVAS Files Section, folder: HW Problems. Use this A matrix to construct the column-stochastic matrix S. You must write the S matrix construction code in a way that dangling nodes are accounted as per Lec. 17, p. 14. In other words, your code should be general enough to handle any A that has one or more zero columns. (b) (15 + 10 = 25 points] In the same .m file in part (a), define the damping vector alpha = 0.25:0.25:1. Each entry of alpha denotes a specific damping factor a in Lec. 18, p. 1. For each entry of alpha, perform 50 power iterations on the corresponding Google matrix to compute the associated damped PageRank p(a). For each a, obtain the convergence trend as the following figure. Plot power iteration index k in the horizontal axis, and the relative error during iteration ||Pk+1(a) Pk(a)||2 in the ||Pk+1(a)||2 vertical axis using the MATLAB command semilogy. This should be a single figure with four lineplots in four different linecolors: red for a = 0.25, green for a = 0.50, blue for a = 0.75, black for a = 1.00. Please also use MATLAB legend in your figure to clarify which curve is which. Review Lec. 18 video to get intuition on how this plot should look like. (c) (10 points] Recall that a = 1 is the true (undamped) PageRank. Using your code, output the loss of accu- racy in PageRank due to damping by computing the following three % errors: ||p(a = 0.25) pla = 1) ||2 ||p(a = 1)||2 x100, ||p(a = 0.50) p(a = 1)|| 2 ||p(a = 1) ||2 x100, ||p(a = 0.75) pla = 1)||2 x 100. ||p(a = 1)||2 Problem 1 Power iteration to compute PageRank (50 points) We learnt in Lec. 17-18 that for a given Word Wide Web, or equivalently given its adjacency matrix A, the PageRank p is simply the dominant eigenvector of the corresponding Google matrix G (see Lec. 17, p. 9-16, and Lec. 18, p. 1-3). (a) [5 + 10 = 15 points) Write a MATLAB code Yourlastname YourfirstnameHW9p1.m that loads the 500 x 500 adja- cency matrix A from the file AdjacencyMatrix.txt in the CANVAS Files Section, folder: HW Problems. Use this A matrix to construct the column-stochastic matrix S. You must write the S matrix construction code in a way that dangling nodes are accounted as per Lec. 17, p. 14. In other words, your code should be general enough to handle any A that has one or more zero columns. (b) (15 + 10 = 25 points] In the same .m file in part (a), define the damping vector alpha = 0.25:0.25:1. Each entry of alpha denotes a specific damping factor a in Lec. 18, p. 1. For each entry of alpha, perform 50 power iterations on the corresponding Google matrix to compute the associated damped PageRank p(a). For each a, obtain the convergence trend as the following figure. Plot power iteration index k in the horizontal axis, and the relative error during iteration ||Pk+1(a) Pk(a)||2 in the ||Pk+1(a)||2 vertical axis using the MATLAB command semilogy. This should be a single figure with four lineplots in four different linecolors: red for a = 0.25, green for a = 0.50, blue for a = 0.75, black for a = 1.00. Please also use MATLAB legend in your figure to clarify which curve is which. Review Lec. 18 video to get intuition on how this plot should look like. (c) (10 points] Recall that a = 1 is the true (undamped) PageRank. Using your code, output the loss of accu- racy in PageRank due to damping by computing the following three % errors: ||p(a = 0.25) pla = 1) ||2 ||p(a = 1)||2 x100, ||p(a = 0.50) p(a = 1)|| 2 ||p(a = 1) ||2 x100, ||p(a = 0.75) pla = 1)||2 x 100. ||p(a = 1)||2
Step by Step Solution
There are 3 Steps involved in it

Get step-by-step solutions from verified subject matter experts