

Question: can someone do 8-11 please begin{tabular}{|c|c|c|c|} hline Concentration,Pb(ppm) & No.ReplicatesN & MeanAnalyticalSignal,S & StandardDeviation(units) hline 0.00 & 12 & 2.10 & 0.004 hline
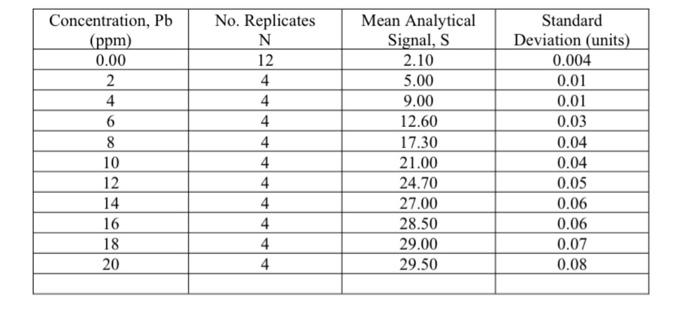
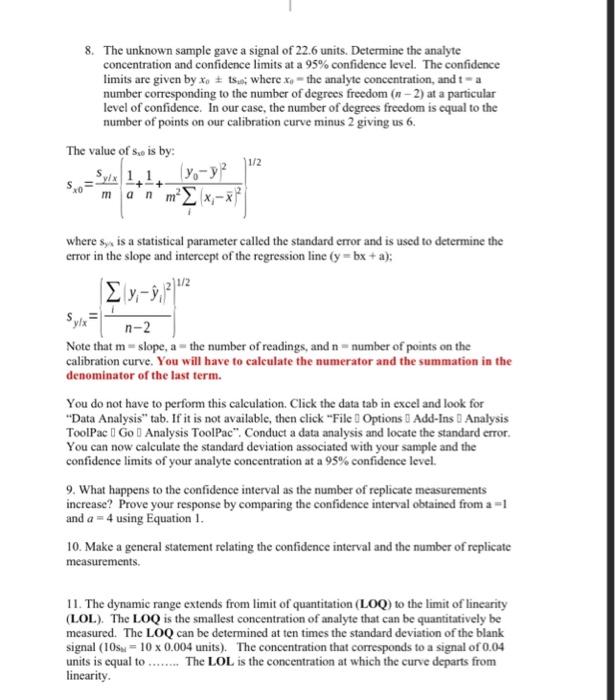
\begin{tabular}{|c|c|c|c|} \hline Concentration,Pb(ppm) & No.ReplicatesN & MeanAnalyticalSignal,S & StandardDeviation(units) \\ \hline 0.00 & 12 & 2.10 & 0.004 \\ \hline 2 & 4 & 5.00 & 0.01 \\ \hline 4 & 4 & 9.00 & 0.01 \\ \hline 6 & 4 & 12.60 & 0.03 \\ \hline 8 & 4 & 17.30 & 0.04 \\ \hline 10 & 4 & 21.00 & 0.04 \\ \hline 12 & 4 & 24.70 & 0.05 \\ \hline 14 & 4 & 27.00 & 0.06 \\ \hline 16 & 4 & 28.50 & 0.06 \\ \hline 18 & 4 & 29.00 & 0.07 \\ \hline 20 & 4 & 29.50 & 0.08 \\ \hline & & & \\ \hline \end{tabular} 8. The unknown sample gave a signal of 22.6 units. Determine the analyte concentration and confidence limits at a 95% confidence level. The confidence limits are given by x0t1; where x0= the analyte concentration, and t= a number corresponding to the number of degrees freedom (n2) at a particular level of confidence. In our case, the number of degrees freedom is equal to the number of points on our calibration curve minus 2 giving us 6. The value of ss,0 is by: sx0=msy/x(a1+n1+m2i(xix)2(y0y)2)1/2 where sy is a statistical parameter called the standard error and is used to determine the error in the slope and intercept of the regression line (y=bx+a); Sy/x=(n2i(yiy^i)2)1/2)1/2 Note that m= slope, a= the number of readings, and n= number of points on the calibration curve. You will have to calculate the numerator and the summation in the denominator of the last term. You do not have to perform this calculation. Click the data tab in excel and look for "Data Analysis" tab. If it is not available, then click "File [] Options II Add-Ins [ Analysis ToolPac [ Go [ Analysis ToolPac". Conduct a data analysis and locate the standard error. You can now calculate the standard deviation associated with your sample and the confidence limits of your analyte concentration at a 95% confidence level. 9. What happens to the confidence interval as the number of replicate measurements increase? Prove your response by comparing the confidence interval obtained from a =1 and a=4 using Equation 1 . 10. Make a general statement relating the confidence interval and the number of replicate measurements. 11. The dynamic range extends from limit of quantitation (LOQ) to the limit of linearity (LOL). The LOQ is the smallest concentration of analyte that can be quantitatively be measured. The LOQ can be determined at ten times the standard deviation of the blank signal ( 10sM=100.004 units). The concentration that corresponds to a signal of 0.04 units is equal to ........ The LOL is the concentration at which the curve departs from linearity
Step by Step Solution
There are 3 Steps involved in it

Get step-by-step solutions from verified subject matter experts