

Question: Can someone explain how to solve an inequality both graphically and analytically? I had the following two problems where we had to solve the inequality
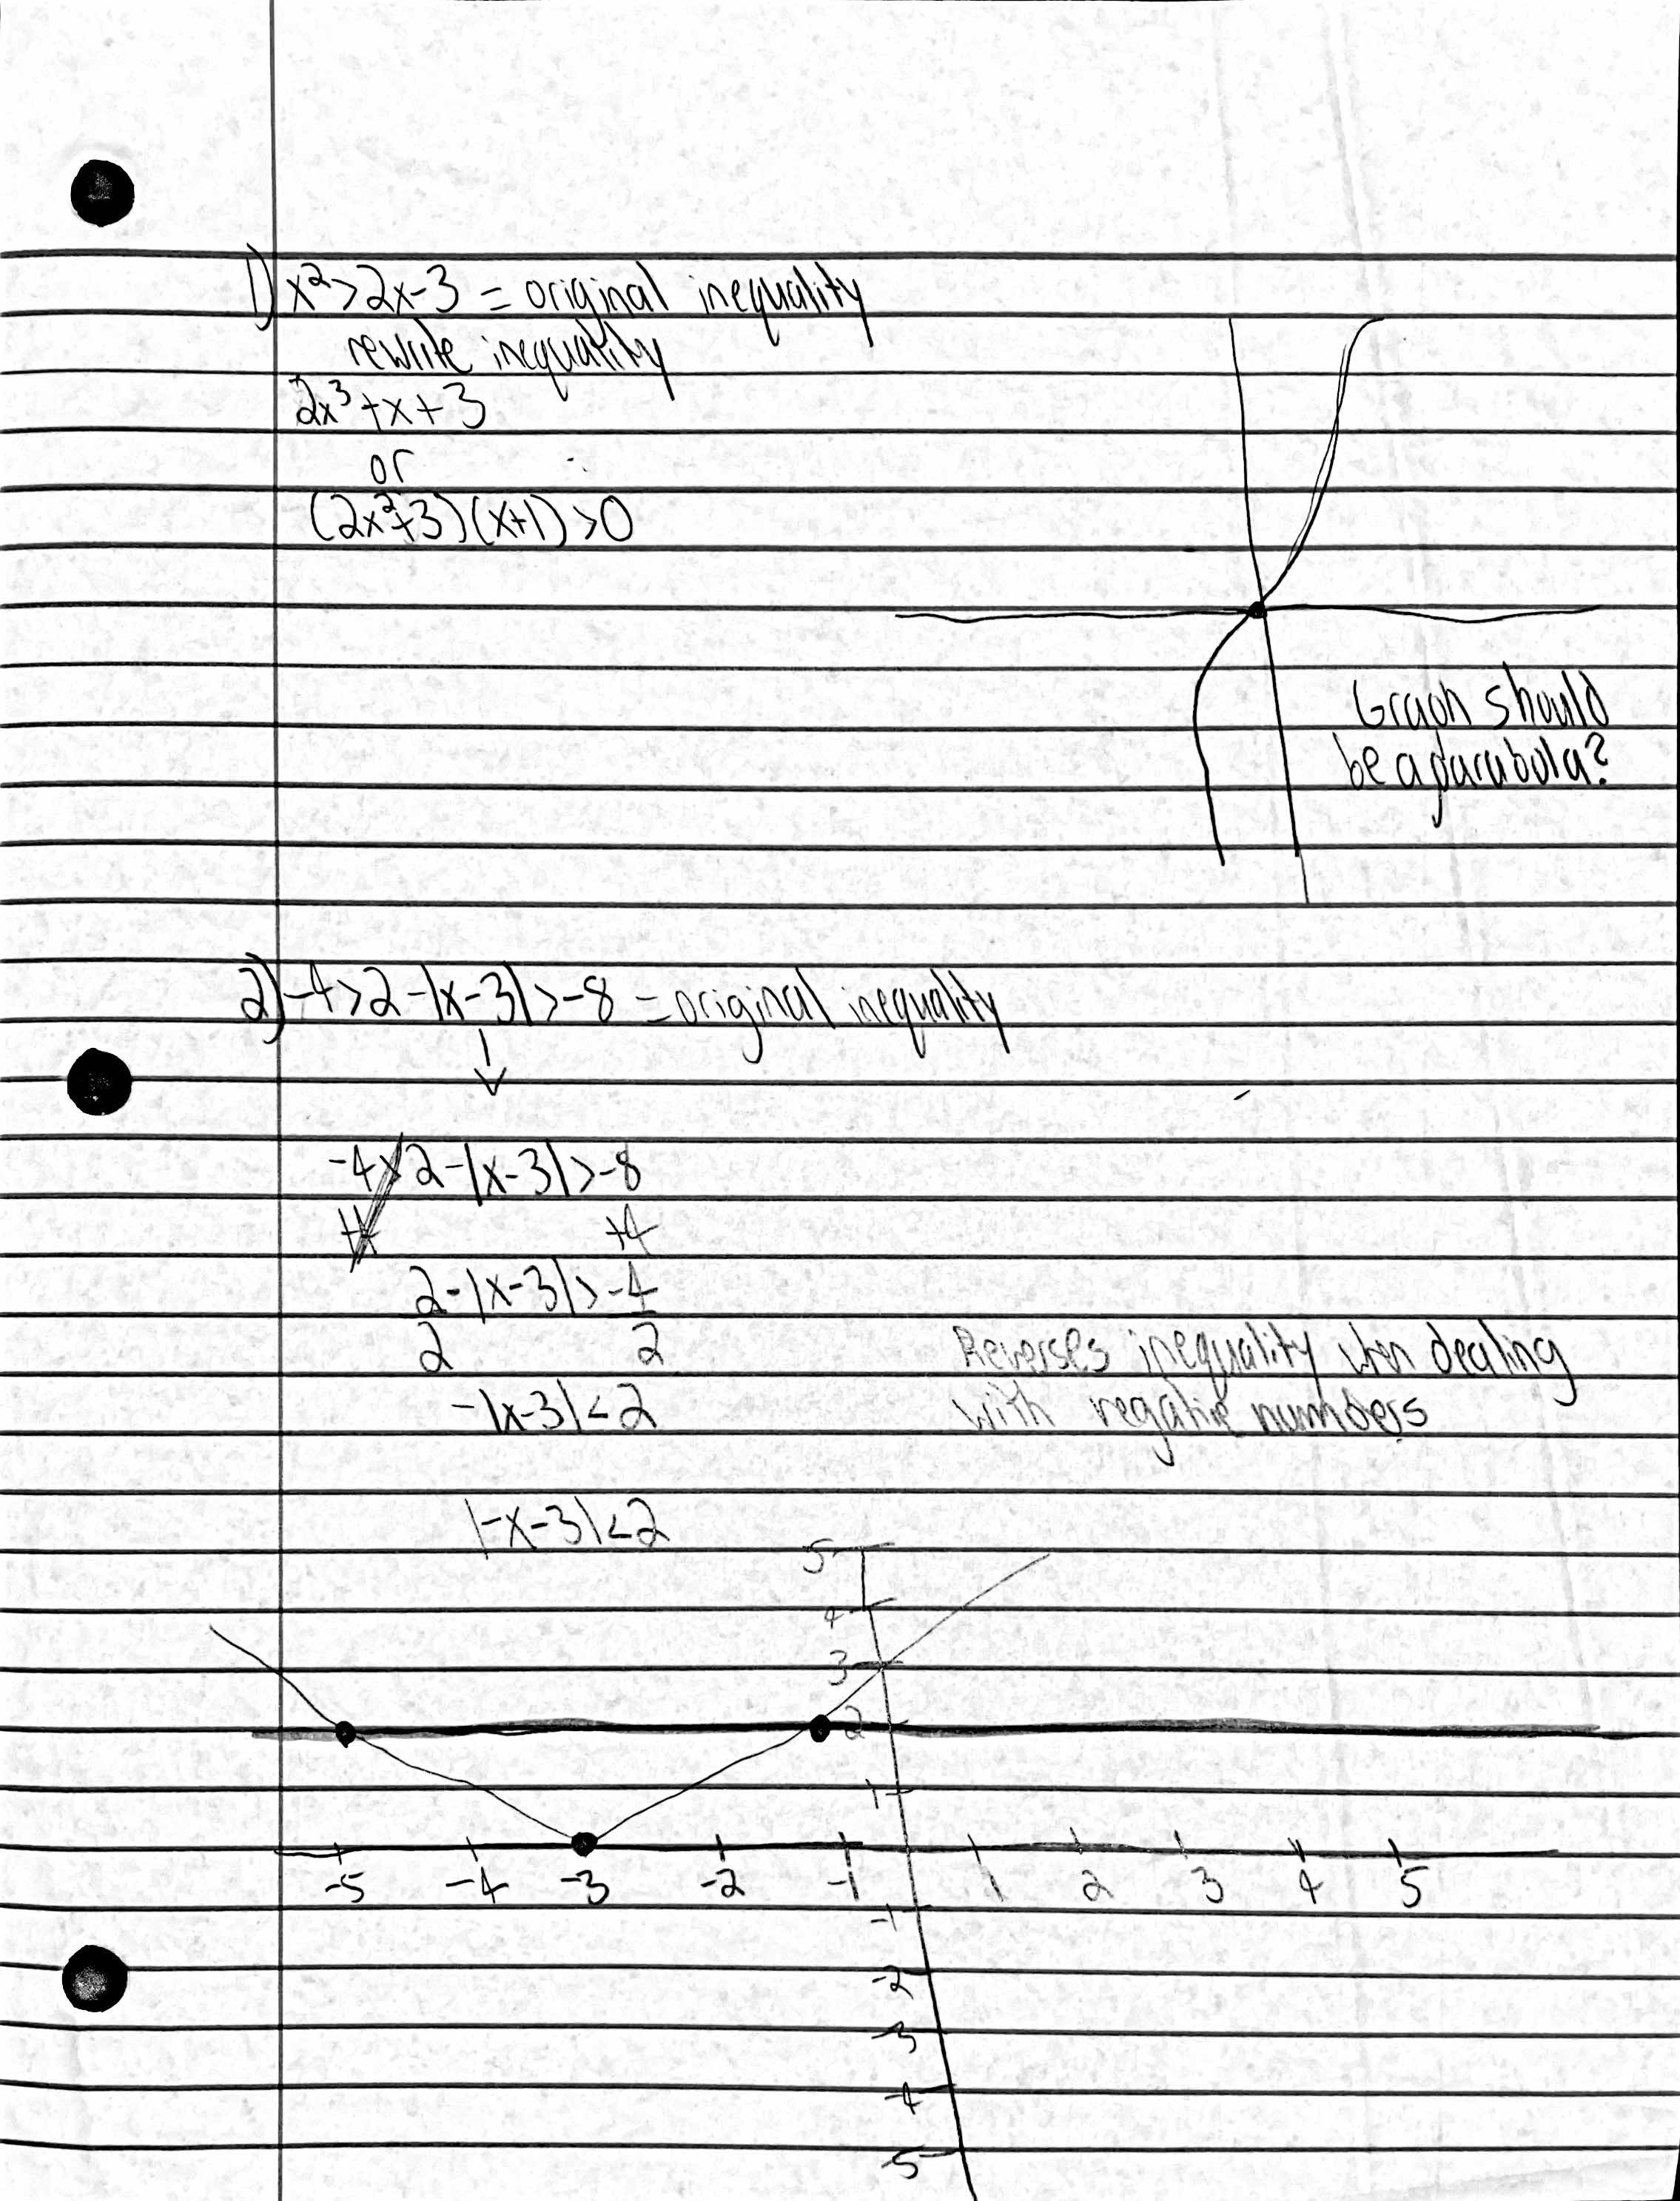
Can someone explain how to solve an inequality both graphically and analytically? I had the following two problems where we had to solve the inequality using a graph but I am not sure if I did it right. For the first one at the least I do not think I set it up/rewrite correctly as our example problem was a parabola and that is not what I got for my graph. What did I do wrong? For the second problem two I am not sure if I set the equation up properly or if my graph is right but I am a bit more confident in that one. I am wondering if anyone can explain thank you!
\f
Step by Step Solution
There are 3 Steps involved in it
1 Expert Approved Answer
Step: 1 Unlock

Question Has Been Solved by an Expert!
Get step-by-step solutions from verified subject matter experts
Step: 2 Unlock
Step: 3 Unlock