

Question: Can someone explain this question? I know the 4-bin equal-width technique. And I know how to sort the range. However, I do not understand how
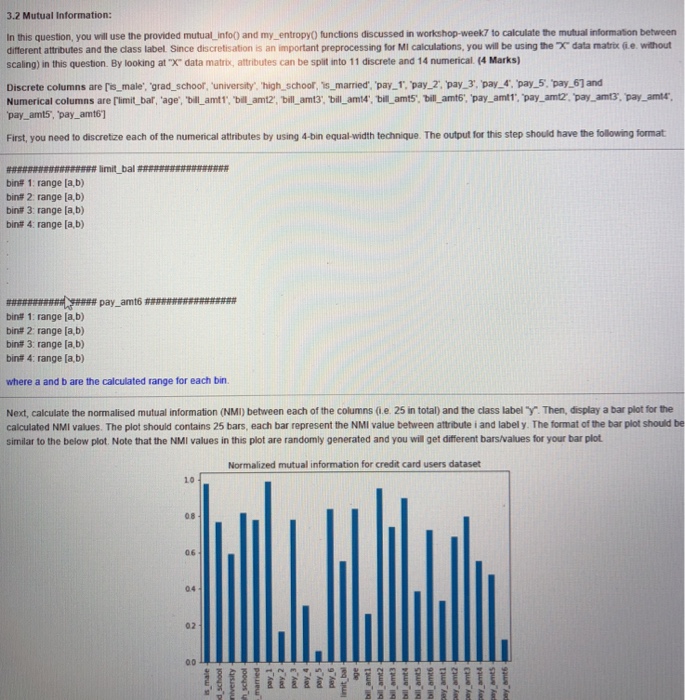
3.2 Mutual Information: to calculate the mutual information between In this question, you will use the provided mutual infoO and my_entropy0 functions discussed in workshop-week7 different attributes and the class label Since discretisation is an important preprocessing for MI calculations, you will be using the X" data matrix G e. without scaling) in this question. By looking at "X-data matrix, attributes can be spat into 11 discrete and 14 numerical (4 Marks) Discrete columns are [is male', 'grad_schoof, university, high schoor, is_married, pay 1, pay_2, pay 3, pay 4, pay 5, pay 61 and Numerical columns are [limit bar, age, bill amt, bill amt2, bill amt3 bill am4, bill amts, vill amt6, 'pay amt, pay amtz, 'pay amt3, pay amtr pay amt5, pay amt6] First, you need to discretize each of the numerical attributes by using 4-bin equal-width technique. The output for this step should have the following format bin# 1 range [a,b) bin# 2 range [a,b) bin# 3: range [a,b) bin# 4 range [a,b) ### pay_am16##FFFFFF###### ngela bint 2 range [a,b) bint 3 range [a,b) bint 4: range [a,b) where a and b are the calculated range for each bin Next, calculate the normalised mutual information (NMI) between each of the columns (i.e. 25 in total) and the class label y. Then, display a bar plot for the calculated NMI values. The plot should contains 25 bars, each bar represent the NMI value between attribute i and label y. The format of the bar plot should be similar to the below plot. Note that the NMI values in this plot are randomly generated and you will get different bars/values for your bar plot Normalized mutual information for credit card users dataset 1.0 08 0 6 04 02
Step by Step Solution
There are 3 Steps involved in it

Get step-by-step solutions from verified subject matter experts