

Question: Can someone help me with MatplotLib? I need to write a code that will make my output look like the second one. I am working
Can someone help me with MatplotLib? I need to write a code that will make my output look like the second one. I am working on google colab
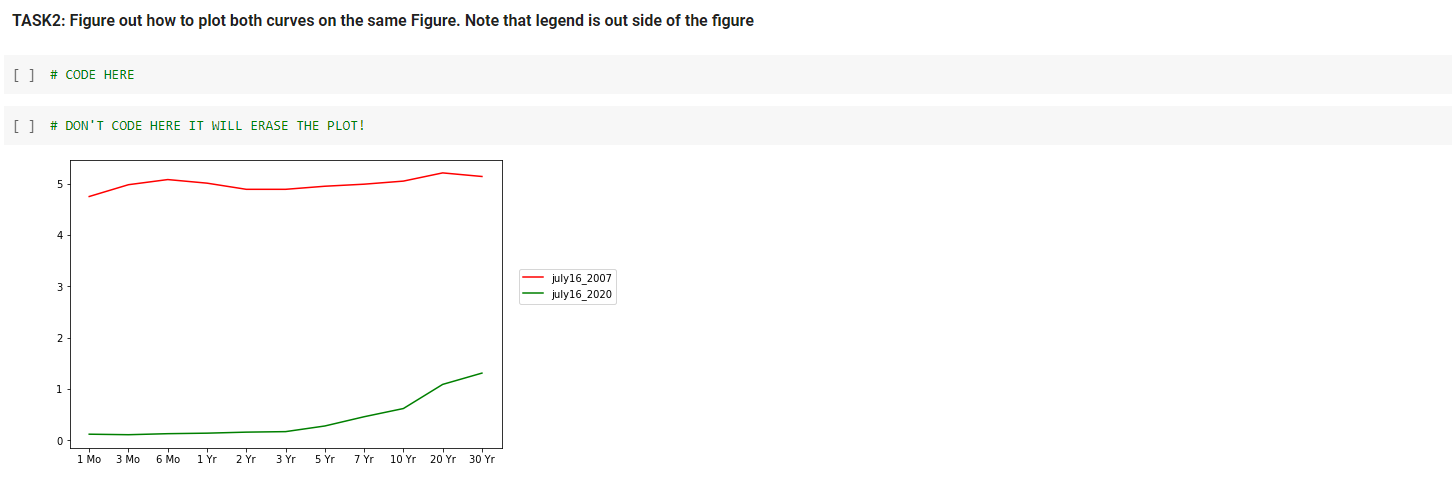
TASK2: Figure out how to plot both curves on the same Figure. Note that legend is out side of the figure [] # CODE HERE [] # DON'T CODE HERE IT WILL ERASE THE PLOT! 4 3 july16_2007 july 16 2020 2 1 0 1 Mo 3 Mo 6 Mo 1 Yr 2 Yr 3 Yr 5 Yr 7 Yr 10 Yr 20 Y 30 Yr
Step by Step Solution
There are 3 Steps involved in it
1 Expert Approved Answer
Step: 1 Unlock

Question Has Been Solved by an Expert!
Get step-by-step solutions from verified subject matter experts
Step: 2 Unlock
Step: 3 Unlock