

Question: Can someone please break down how to figure this out? I am not getting the correct answer. Thank you. Webster Chemical Company produces mastics and
Can someone please break down how to figure this out? I am not getting the correct answer. Thank you.
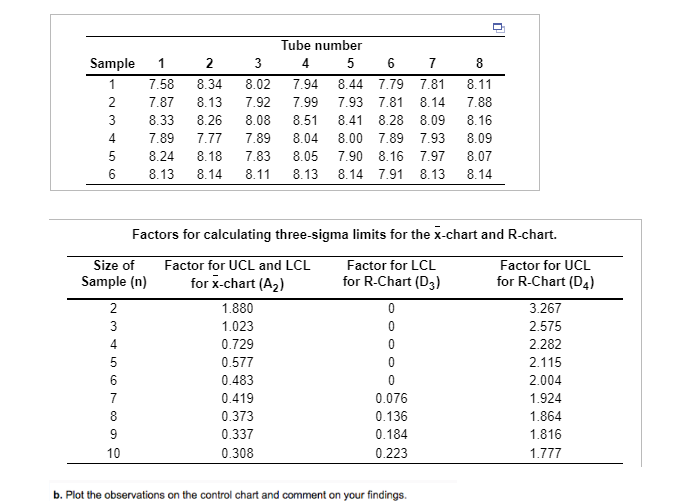
Webster Chemical Company produces mastics and caulking for the construction industry. The product is blended in large mixers and then pumped into tubes and capped. Management is concerned about whether the filling process for tubes of caulking is in statistical control. The process should be centered on ounces per tube. Several samples of eight tubes were taken, each tube was weighed, and the weights in the table below were obtained.
LOADING...
Click the icon to view the ounces of caulking per tube data.
LOADING...
Click the icon to view the table of factors for calculating threesigma limits for the
x overbarxchart
and Rchart.
Part
a Assume that only six samples are sufficient and develop the control charts for the mean and the range.
Set up the Rchart by specifying the center line and threesigma control limits below. Enter your responses rounded to three decimal places.
Rchart
UCL Subscript Upper RUCLR equals enter your response here
Upper R overbarR equals enter your response here
LCL Subscript Upper RLCLR equals enter your response here
Xchart
UCL Subscript Upper RUCLR equals enter your response here
Upper R overbarR equals enter your response here
LCL Subscript Upper RLCLR equals enter your response hereFactors for calculating threesigma limits for the chart and Rchart.
b Plot the observations on the control chart and comment on your findings.
Step by Step Solution
There are 3 Steps involved in it
1 Expert Approved Answer
Step: 1 Unlock

Question Has Been Solved by an Expert!
Get step-by-step solutions from verified subject matter experts
Step: 2 Unlock
Step: 3 Unlock