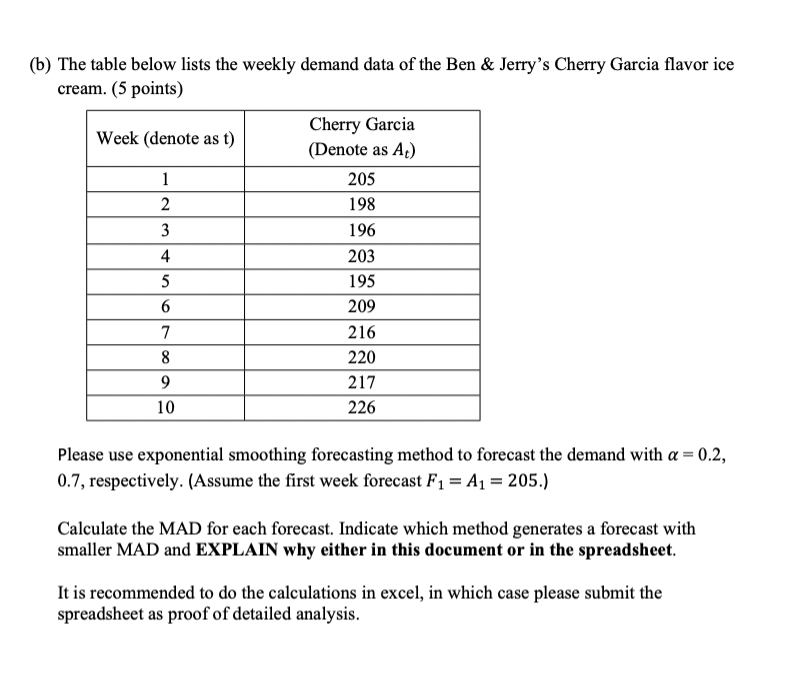
Question: Can someone please help me solve this and show steps in excel. (b) The table below lists the weekly demand data of the Ben &

Can someone please help me solve this and show steps in excel.

Can someone please help me solve this and show

(b) The table below lists the weekly demand data of the Ben & Jerry's Cherry Garcia flavor ice cream. (5 points) Cherry Garcia Week (denote as t) (Denote as At) 1 205 2 198 3 196 4 203 5 195 6 209 7 216 8 220 9 217 10 226 AN Please use exponential smoothing forecasting method to forecast the demand with a = 0.2, 0.7, respectively. (Assume the first week forecast F1 = A1 = 205.) Calculate the MAD for each forecast. Indicate which method generates a forecast with smaller MAD and EXPLAIN why either in this document or in the spreadsheet. It is recommended to do the calculations in excel, in which case please submit the spreadsheet as proof of detailed analysis

Step by Step Solution

There are 3 Steps involved in it

1 Expert Approved Answer
Step: 1 Unlock blur-text-image
Question Has Been Solved by an Expert!

Get step-by-step solutions from verified subject matter experts

Step: 2 Unlock
Step: 3 Unlock

Students Have Also Explored These Related General Management Questions!