

Question: Can someone please help me with my financial analysis assignment? I am truly struggling. Thank you so much in advance! Objective The financial analysis period
Can someone please help me with my financial analysis assignment? I am truly struggling. Thank you so much in advance!
Objective
The financial analysis period must be, at a minimum, the three most recent years. You are required to evaluate the financial performance of a publicly traded US Corporation.
Choosing your firm
You will analyze: MoneyGram and Western Union
Description
Balance Sheet, a Statement of Cash Flows, and Income Statement provided(Below).
- Executive Summary
- Ratio Calculation*
- Ratio Analysis*
- Projected financial statements including income statements, balance sheets, and statements of cash flows
- Your opinion on the overall financial health of each company
*The Ratio Calculations should be done in a table in Excel and included with your submission. The following ratios should be included for each company and for 2 years :
- Working Capital
- Current Ratio
- Total Debt to Total Equity Ratio
- Times Interest Earned
- RNOA
- ROCE
Please show all calculations/all of your work.
*The ratio analysis should include an explanation of the importance of each ratio, what the ratio tells you about each company, how the ratio changes from year to year, and which company appears better based on each ratio.
The Projected financial statements should be done in Excel. * You will need to make necessary adjustments for material non-recurring or unusual income or expenses as well as off-balance sheet assets or liabilities, among others as covered in the course. The adjustment will improve comparability and ensure accurate representation of the organization's economic performance. Be sure to identify important assumptions regarding the companies, industry and business environment, and other important assumptions for estimates and forecasts, including their business strategies.
Your opinion of the overall financial health of the company should be reflected.
You should include:
- The financial statements from the companies you analyzed
- The Excel Ratio Table Calculations
- The Excel Projected Financial Statements
Data For MoneyGram 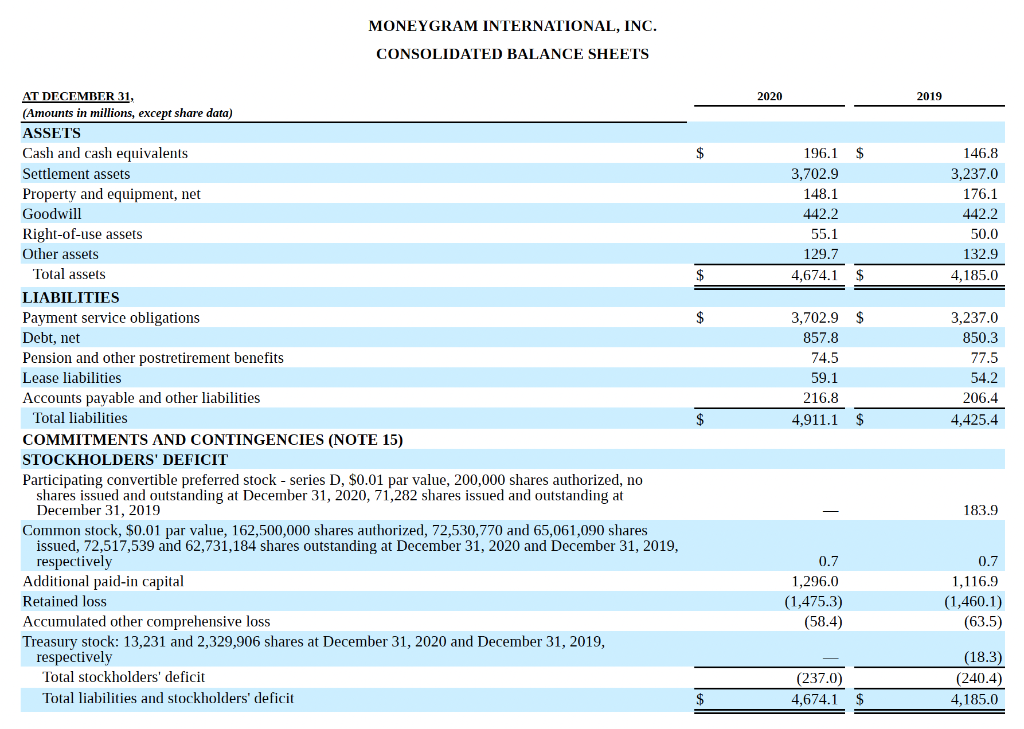
Data for Western Union
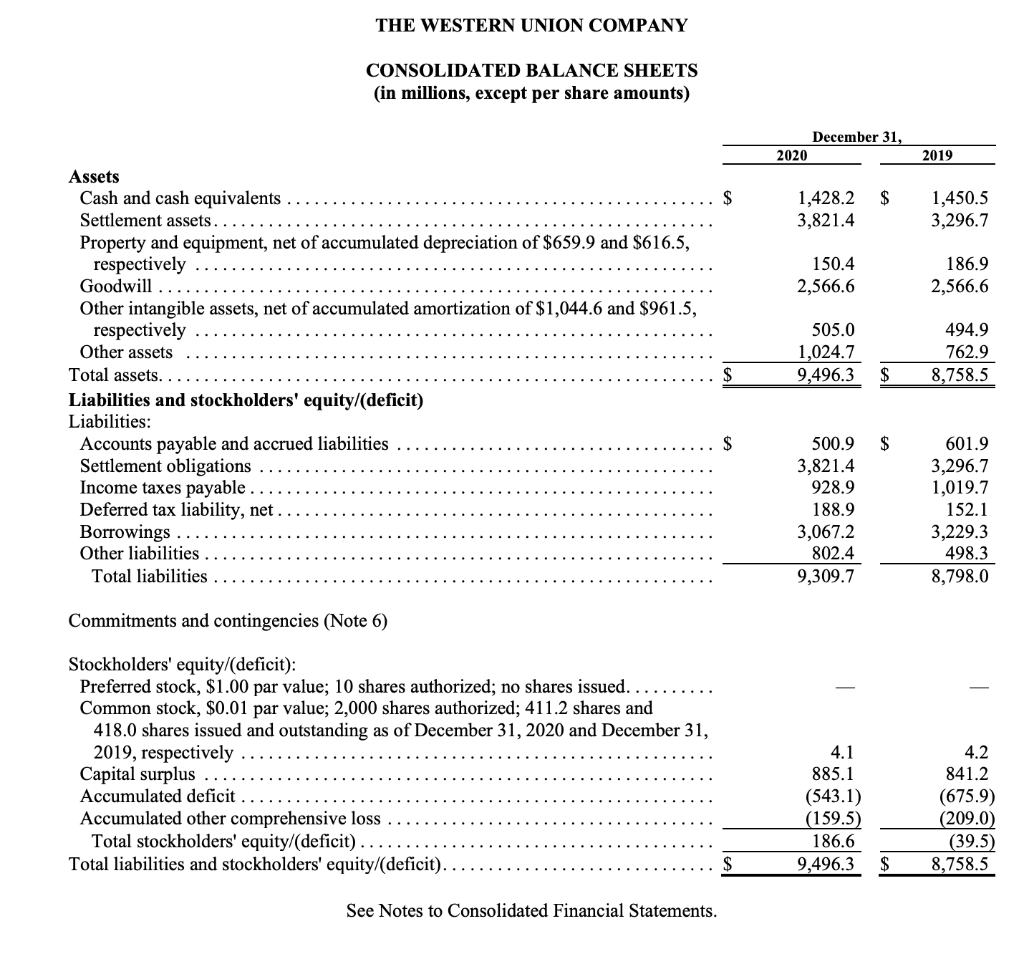
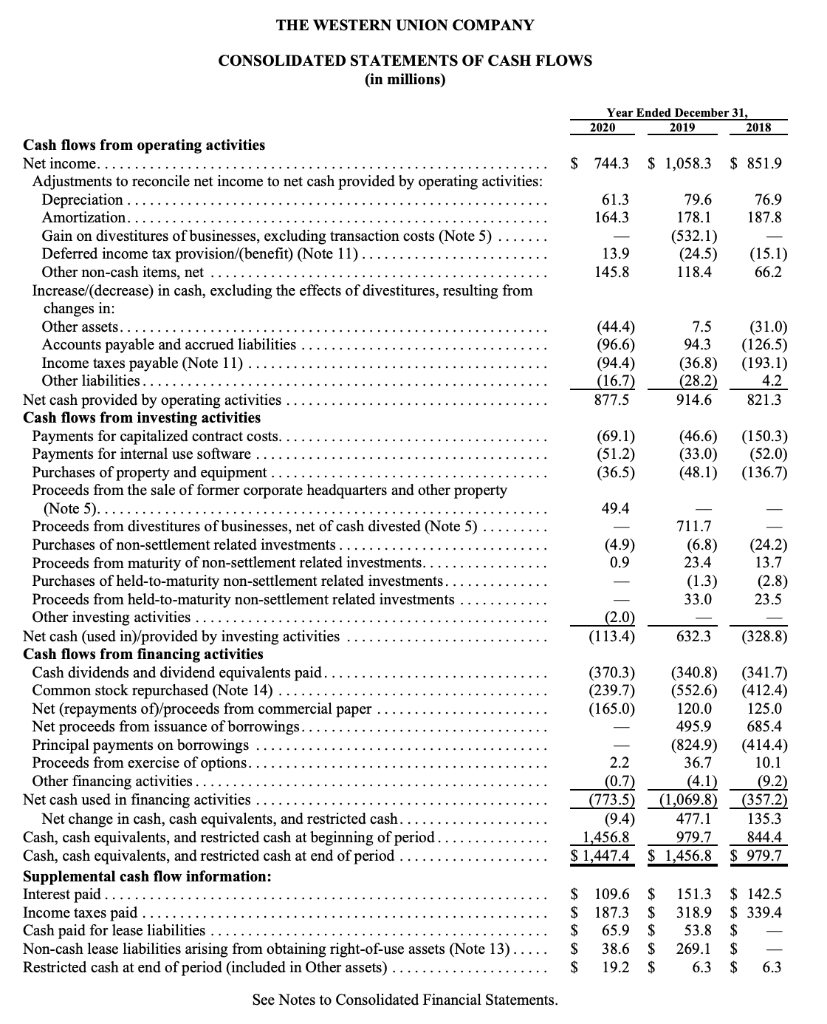
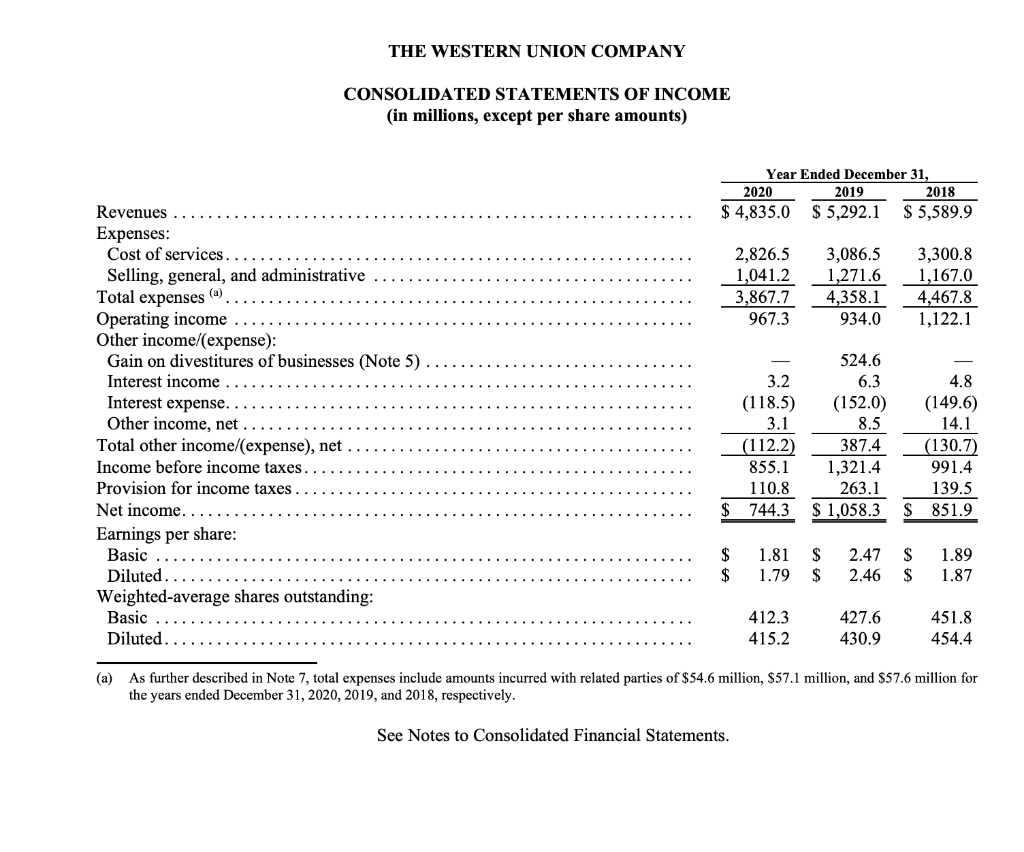
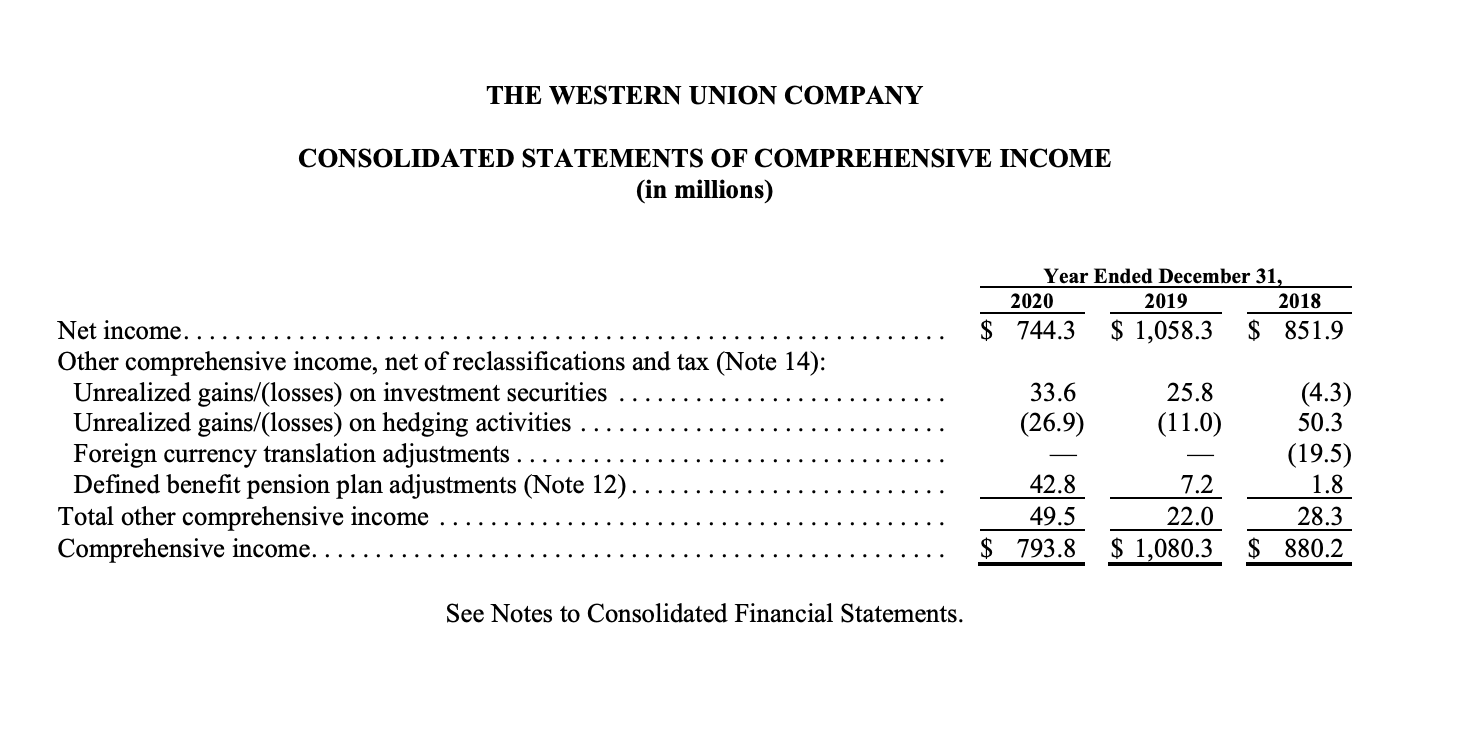
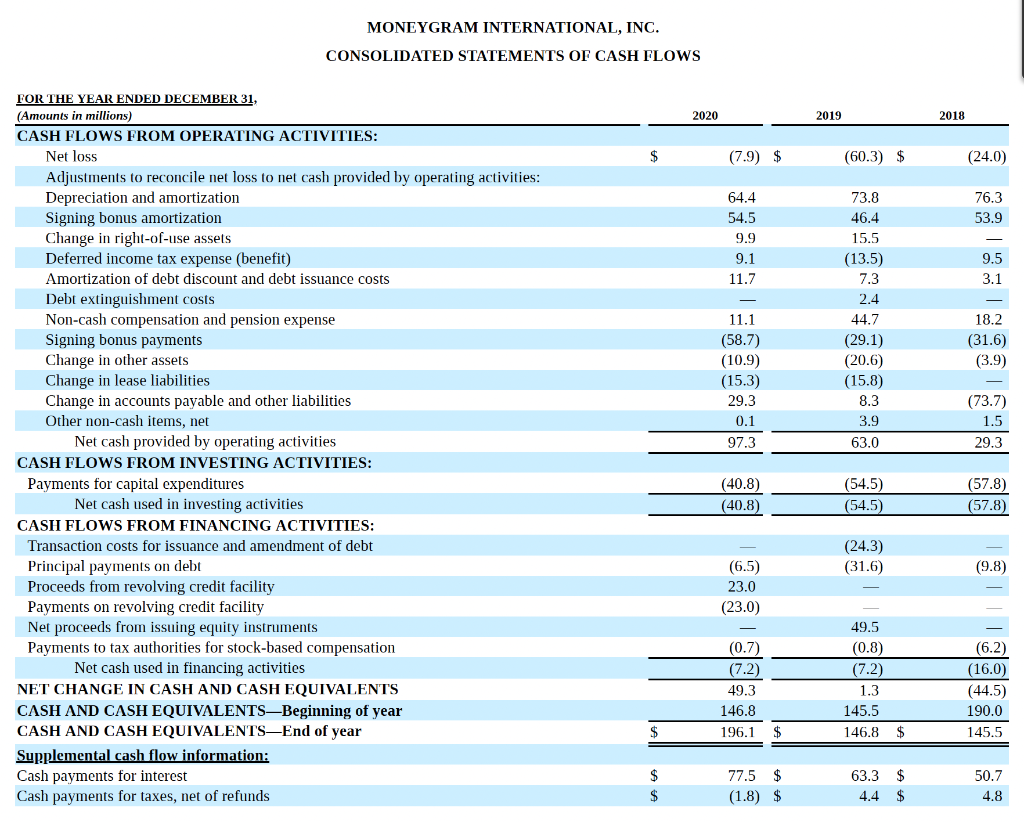
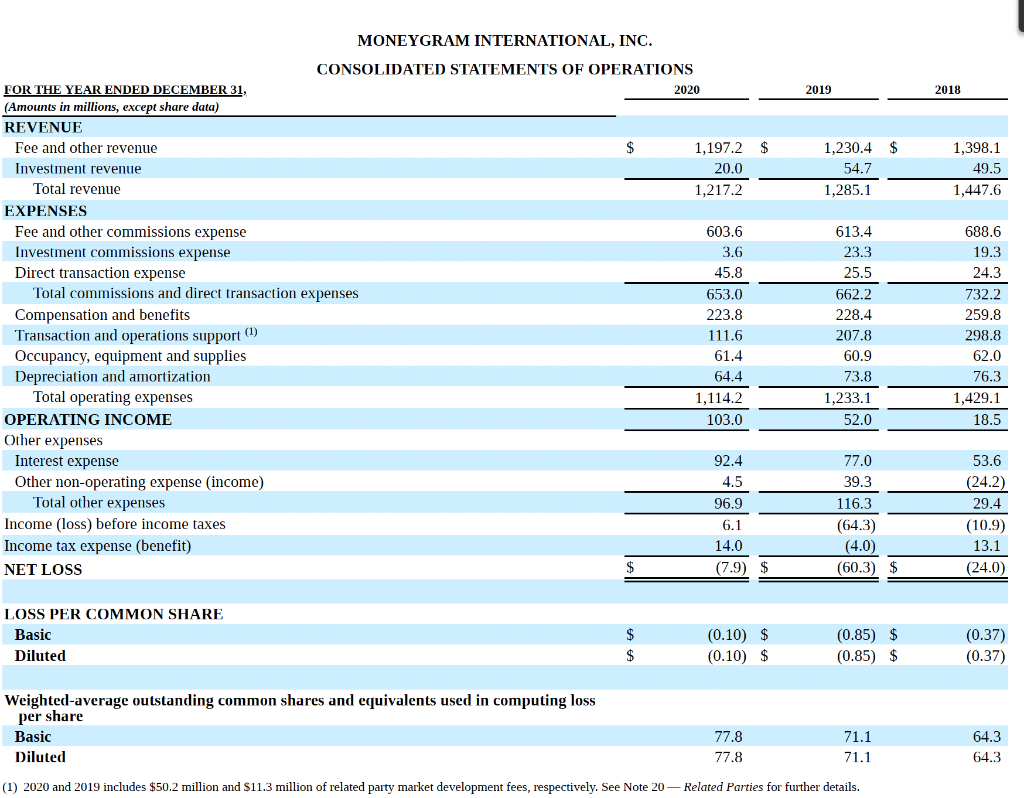
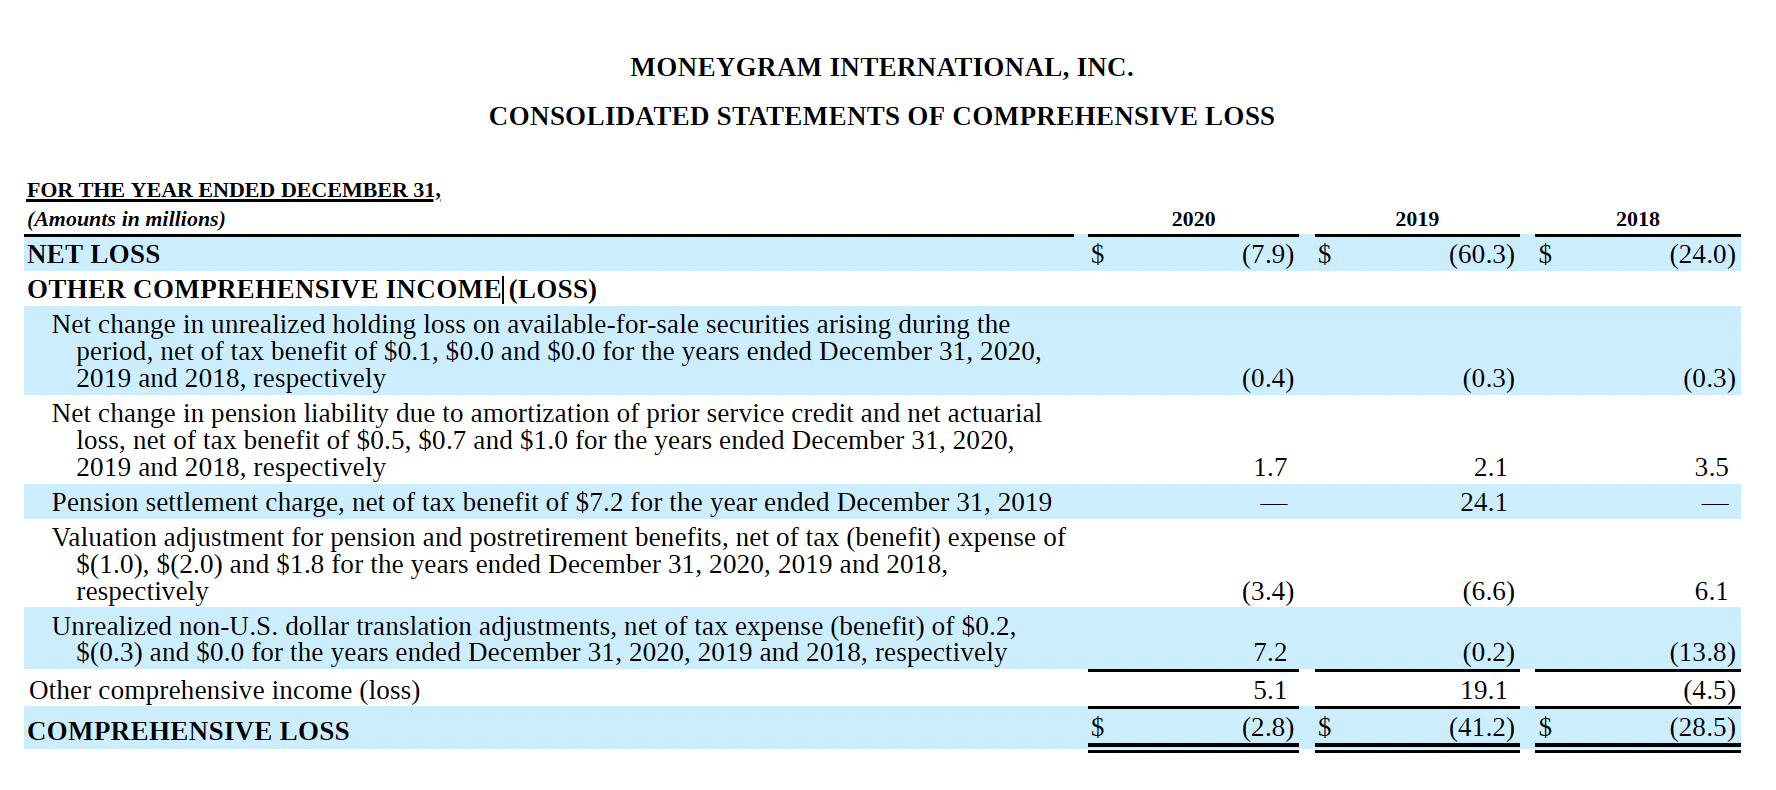
MONEYGRAM INTERNATIONAL, INC. CONSOLIDATED BALANCE SHEETS 2020 2019 $ $ 196.1 3,702.9 148.1 442.2 55.1 129.7 4,674.1 146.8 3,237.0 176.1 442.2 50.0 132.9 4,185.0 $ $ AT DECEMBER 31, (Amounts in millions, except share data) ASSETS Cash and cash equivalents Settlement assets Property and equipment, net Goodwill Right-of-use assets Other assets Total assets LIABILITIES Payment service obligations Debt, net Pension and other postretirement benefits Lease liabilities Accounts payable and other liabilities Total liabilities COMMITMENTS AND CONTINGENCIES (NOTE 15) STOCKHOLDERS' DEFICIT Participating convertible preferred stock - series D, $0.01 par value, 200,000 shares authorized, no shares issued and outstanding at December 31, 2020, 71,282 shares issued and outstanding at December 31, 2019 Common stock, $0.01 par value, 162,500,000 shares authorized, 72,530,770 and 65,061,090 shares issued, 72,517,539 and 62,731,184 shares outstanding at December 31, 2020 and December 31, 2019, respectively Additional paid-in capital Retained loss Accumulated other comprehensive loss Treasury stock: 13,231 and 2,329,906 shares at December 31, 2020 and December 31, 2019, respectively Total stockholders' deficit Total liabilities and stockholders' deficit 3,702.9 $ 857.8 74.5 59.1 216.8 4,911.1 $ 3,237.0 850.3 77.5 54.2 206.4 4,425.4 183.9 0.7 1,296.0 (1,475.3) (58.4) 0.7 1,116.9 (1,460.1) (63.5) (237.0) 4,674.1 (18.3) (240.4) 4,185.0 $ MONEYGRAM INTERNATIONAL, INC. CONSOLIDATED STATEMENTS OF CASH FLOWS 2020 2019 2018 $ (7.9) $ (60.3) $ (24.0) 76.3 53.9 64.4 54.5 9.9 9.1 11.7 9.5 3.1 73.8 46.4 15.5 (13.5) 7.3 2.4 44.7 (29.1) (20.6) (15.8) 8.3 3.9 63.0 - 11.1 (58.7) (10.9) (15.3) 29.3 0.1 97.3 18.2 (31.6) (3.9) (73.7) 1.5 29.3 FOR THE YEAR ENDED DECEMBER 31, (Amounts in millions) CASH FLOWS FROM OPERATING ACTIVITIES: Net loss Adjustments to reconcile net loss to net cash provided by operating activities: Depreciation and amortization Signing bonus amortization Change in right-of-use assets Deferred income tax expense (benefit) Amortization of debt discount and debt issuance costs Debt extinguishment costs Non-cash compensation and pension expense Signing bonus payments Change in other assets Change in lease liabilities Change in accounts payable and other liabilities Other non-cash items, net Net cash provided by operating activities CASH FLOWS FROM INVESTING ACTIVITIES: Payments for capital expenditures Net cash used in investing activities CASH FLOWS FROM FINANCING ACTIVITIES: Transaction costs for issuance and amendment of debt Principal payments on debt Proceeds from revolving credit facility Payments on revolving credit facility Net proceeds from issuing equity instruments Payments to tax authorities for stock-based compensation Net cash used in financing activities NET CHANGE IN CASH AND CASH EQUIVALENTS CASH AND CASH EQUIVALENTSBeginning of year CASH AND CASH EQUIVALENTS-End of year Supplemental cash flow information: Cash payments for interest Cash payments for taxes, net of refunds (40.8) (54.5) (54.5) (57.8) (57.8) (40.8) (24.3) (31.6) (9.8) (6.5) 23.0 (23.0) (0.7) (7.2) 49.3 146.8 196.1 49.5 (0.8) (7.2) 1.3 145.5 146.8 $ (6.2) (16.0) (44.5) 190.0 145.5 $ $ 77.5 $ (1.8) $ 63.3 $ 4.4 $ 50.7 4.8 2020 2019 2018 1,230.4 $ 54.7 1,285.1 1,398.1 49.5 1,447.6 MONEYGRAM INTERNATIONAL, INC. CONSOLIDATED STATEMENTS OF OPERATIONS FOR THE YEAR ENDED DECEMBER 31, (Amounts in millions, except share data) REVENUE Fee and other revenue $ 1,197.2 $ Investment revenue 20.0 Total revenue 1,217.2 EXPENSES Fee and other commissions expense 603.6 Investment commissions expense 3.6 Direct transaction expense 45.8 Total commissions and direct transaction expenses 653.0 Compensation and benefits 223.8 Transaction and operations support (1) 111.6 Occupancy, equipment and supplies 61.4 Depreciation and amortization 64.4 Total operating expenses 1,114.2 OPERATING INCOME 103.0 Other expenses Interest expense 92.4 Other non-operating expense (income) 4.5 Total other expenses 96.9 Income (loss) before income taxes 6.1 Income tax expense (benefit) 14.0 NET LOSS (7.9) 613.4 23.3 25.5 662.2 228.4 207.8 60.9 73.8 1.233.1 52.0 688.6 19.3 24.3 732.2 259.8 298.8 62.0 76.3 1,429.1 18.5 77.0 39.3 116.3 (64.3) (4.0) (60.3) $ 53.6 (24.2) 29.4 (10.9) 13.1 (24.0) S LOSS PER COMMON SHARE Basic Diluted $ (0.10) $ (0.10) $ (0.85) $ (0.85) $ (0.37) (0.37) $ Weighted average outstanding common shares and equivalents used in computing loss per share Basic Diluted 77.8 77.8 71.1 71.1 64.3 64.3 (1) 2020 and 2019 includes $50.2 million and $11.3 million of related party market development fees, respectively. See Note 20 - Related Parties for further details. MONEYGRAM INTERNATIONAL, INC. CONSOLIDATED STATEMENTS OF COMPREHENSIVE LOSS 2020 2019 2018 $ (7.9) $ (60.3) $ (24.0) (0.4) (0.3) (0.3) FOR THE YEAR ENDED DECEMBER 31, (Amounts in millions) NET LOSS OTHER COMPREHENSIVE INCOME|(LOSS) Net change in unrealized holding loss on available-for-sale securities arising during the period, net of tax benefit of $0.1, $0.0 and $0.0 for the years ended December 31, 2020, 2019 and 2018, respectively Net change in pension liability due to amortization of prior service credit and net actuarial loss, net of tax benefit of $0.5, $0.7 and $1.0 for the years ended December 31, 2020, 2019 and 2018, respectively Pension settlement charge, net of tax benefit of $7.2 for the year ended December 31, 2019 Valuation adjustment for pension and postretirement benefits, net of tax (benefit) expense of $(1.0), $(2.0) and $1.8 for the years ended December 31, 2020, 2019 and 2018, respectively Unrealized non-U.S. dollar translation adjustments, net of tax expense (benefit) of $0.2, $(0.3) and $0.0 for the years ended December 31, 2020, 2019 and 2018, respectively Other comprehensive income (loss) COMPREHENSIVE LOSS 1.7 2.1 3.5 24.1 (3.4) (6.6) 6.1 7.2 5.1 (2.8) $ (0.2) 19.1 (41.2) $ (13.8) (4.5) (28.5) $ THE WESTERN UNION COMPANY CONSOLIDATED BALANCE SHEETS (in millions, except per share amounts) December 31, 2020 2019 $ $ 1,428.2 3,821.4 1,450.5 3,296.7 150.4 186.9 2,566.6 2,566.6 Assets Cash and cash equivalents Settlement assets. Property and equipment, net of accumulated depreciation of $659.9 and $616.5, respectively Goodwill Other intangible assets, net of accumulated amortization of $1,044.6 and $961.5, respectively Other assets Total assets. Liabilities and stockholders' equity/(deficit) Liabilities: Accounts payable and accrued liabilities Settlement obligations Income taxes payable. Deferred tax liability, net Borrowings Other liabilities Total liabilities 505.0 1,024.7 9,496.3 494.9 762.9 8,758.5 $ $ $ 500.9 3,821.4 928.9 188.9 3,067.2 802.4 9,309.7 601.9 3,296.7 1,019.7 152.1 3,229.3 498.3 8,798.0 Commitments and contingencies (Note 6) Stockholders' equity/(deficit): Preferred stock, $1.00 par value; 10 shares authorized; no shares issued. Common stock, $0.01 par value; 2,000 shares authorized; 411.2 shares and 418.0 shares issued and outstanding as of December 31, 2020 and December 31, 2019, respectively Capital surplus Accumulated deficit Accumulated other comprehensive loss Total stockholders' equity/(deficit). Total liabilities and stockholders' equity/(deficit). 4.1 885.1 (543.1) (159.5) 186.6 9,496.3 4.2 841.2 (675.9) (209.0) (39.5) 8,758.5 $ See Notes to Consolidated Financial Statements. THE WESTERN UNION COMPANY CONSOLIDATED STATEMENTS OF CASH FLOWS (in millions) Year Ended December 31, 2020 2019 2018 $ 744.3 $ 1,058.3 $ 851.9 61.3 164.3 76.9 187.8 79.6 178.1 (532.1) (24.5) 118.4 13.9 145.8 (15.1) 66.2 7.5 94.3 (44.4) (96.6) (94.4) (16.7) (36.8) (28.2) 914.6 (31.0) (126.5) (193.1) 4.2 821.3 877.5 (69.1) (51.2) (36.5) (46.6) (33.0) (48.1) (150.3) (52.0) (136.7) 49.4 Cash flows from operating activities Net income... Adjustments to reconcile net income to net cash provided by operating activities: Depreciation Amortization. Gain on divestitures of businesses, excluding transaction costs (Note 5) Deferred income tax provision/(benefit) (Note 11).. Other non-cash items, net Increase/(decrease) in cash, excluding the effects of divestitures, resulting from changes in: Other assets. Accounts payable and accrued liabilities Income taxes payable (Note 11) Other liabilities.... Net cash provided by operating activities Cash flows from investing activities Payments for capitalized contract costs. Payments for internal use software Purchases of property and equipment Proceeds from the sale of former corporate headquarters and other property (Note 5). Proceeds from divestitures of businesses, net of cash divested (Note 5) Purchases of non-settlement related investments. Proceeds from maturity of non-settlement related investments. Purchases of held-to-maturity non-settlement related investments. Proceeds from held-to-maturity non-settlement related investments Other investing activities Net cash (used in)/provided by investing activities Cash flows from financing activities Cash dividends and dividend equivalents paid. Common stock repurchased (Note 14) Net (repayments of)/proceeds from commercial paper Net proceeds from issuance of borrowings. Principal payments on borrowings Proceeds from exercise of options. Other financing activities.... Net cash used in financing activities .. Net change in cash, cash equivalents, and restricted cash. Cash, cash equivalents, and restricted cash at beginning of period Cash, cash equivalents, and restricted cash at end of period Supplemental cash flow information: Interest paid... Income taxes paid Cash paid for lease liabilities Non-cash lease liabilities arising from obtaining right-of-use assets (Note 13)... Restricted cash at end of period (included in Other assets) (4.9) 0.9 711.7 (6.8) 23.4 (1.3) 33.0 (24.2) 13.7 (2.8) 23.5 (2.0) (113.4) 632.3 (328.8) (370.3) (239.7) (165.0) 2.2 (0.7) (773.5) (9.4) 1,456.8 $ 1,447.4 (340.8) (552.6) 120.0 495.9 (824.9) 36.7 (4.1) (1,069.8) 477.1 979.7 1,456.8 (341.7) (412.4) 125.0 685.4 (414.4) 10.1 (9.2) (357.2) 135.3 844.4 $ 979.7 $ 109.6 $ $ 187.3 $ $ 65.9 $ S 38.6 $ $ 19.2 $ 151.3 318.9 53.8 269.1 6.3 $ 142.5 $ 339.4 $ $ $ 6.3 See Notes to Consolidated Financial Statements. THE WESTERN UNION COMPANY CONSOLIDATED STATEMENTS OF INCOME (in millions, except per share amounts) Year Ended December 31, 2020 2019 2018 $ 4,835.0 $ 5,292.1 $5,589.9 2,826.5 1,041.2 3,867.7 967.3 3,086.5 1,271.6 4,358.1 934.0 3,300.8 1,167.0 4,467.8 1,122.1 Revenues Expenses: Cost of services. Selling, general, and administrative Total expenses (a) Operating income Other income/expense): Gain on divestitures of businesses (Note 5) Interest income Interest expense. Other income, net Total other income/expense), net Income before income taxes. Provision for income taxes Net income.. Earnings per share: Basic Diluted. Weighted average shares outstanding: Basic Diluted. 3.2 (118.5) 3.1 (112.2) 855.1 110.8 744.3 524.6 6.3 (152.0) 8.5 387.4 1,321.4 263.1 $ 1,058.3 4.8 (149.6) 14.1 (130.7) 991.4 139.5 $ 851.9 $ $ 1.81 1.79 $ $ 2.47 2.46 $ $ 1.89 1.87 412.3 415.2 427.6 430.9 451.8 454.4 (a) As further described in Note 7, total expenses include amounts incurred with related parties of $54.6 million, $57.1 million, and $57.6 million for the years ended December 31, 2020, 2019, and 2018, respectively. See Notes to Consolidated Financial Statements. THE WESTERN UNION COMPANY CONSOLIDATED STATEMENTS OF COMPREHENSIVE INCOME (in millions) Year Ended December 31, 2020 2019 2018 $ 744.3 $ 1,058.3 $ 851.9 33.6 (26.9) 25.8 (11.0) Net income.. Other comprehensive income, net of reclassifications and tax (Note 14): Unrealized gains/(losses) on investment securities Unrealized gains/(losses) on hedging activities Foreign currency translation adjustments . Defined benefit pension plan adjustments (Note 12). Total other comprehensive income Comprehensive income.. (4.3) 50.3 (19.5) 1.8 28.3 $ 880.2 42.8 49.5 $ 793.8 7.2 22.0 $ 1,080.3 See Notes to Consolidated Financial Statements. MONEYGRAM INTERNATIONAL, INC. CONSOLIDATED BALANCE SHEETS 2020 2019 $ $ 196.1 3,702.9 148.1 442.2 55.1 129.7 4,674.1 146.8 3,237.0 176.1 442.2 50.0 132.9 4,185.0 $ $ AT DECEMBER 31, (Amounts in millions, except share data) ASSETS Cash and cash equivalents Settlement assets Property and equipment, net Goodwill Right-of-use assets Other assets Total assets LIABILITIES Payment service obligations Debt, net Pension and other postretirement benefits Lease liabilities Accounts payable and other liabilities Total liabilities COMMITMENTS AND CONTINGENCIES (NOTE 15) STOCKHOLDERS' DEFICIT Participating convertible preferred stock - series D, $0.01 par value, 200,000 shares authorized, no shares issued and outstanding at December 31, 2020, 71,282 shares issued and outstanding at December 31, 2019 Common stock, $0.01 par value, 162,500,000 shares authorized, 72,530,770 and 65,061,090 shares issued, 72,517,539 and 62,731,184 shares outstanding at December 31, 2020 and December 31, 2019, respectively Additional paid-in capital Retained loss Accumulated other comprehensive loss Treasury stock: 13,231 and 2,329,906 shares at December 31, 2020 and December 31, 2019, respectively Total stockholders' deficit Total liabilities and stockholders' deficit 3,702.9 $ 857.8 74.5 59.1 216.8 4,911.1 $ 3,237.0 850.3 77.5 54.2 206.4 4,425.4 183.9 0.7 1,296.0 (1,475.3) (58.4) 0.7 1,116.9 (1,460.1) (63.5) (237.0) 4,674.1 (18.3) (240.4) 4,185.0 $ MONEYGRAM INTERNATIONAL, INC. CONSOLIDATED STATEMENTS OF CASH FLOWS 2020 2019 2018 $ (7.9) $ (60.3) $ (24.0) 76.3 53.9 64.4 54.5 9.9 9.1 11.7 9.5 3.1 73.8 46.4 15.5 (13.5) 7.3 2.4 44.7 (29.1) (20.6) (15.8) 8.3 3.9 63.0 - 11.1 (58.7) (10.9) (15.3) 29.3 0.1 97.3 18.2 (31.6) (3.9) (73.7) 1.5 29.3 FOR THE YEAR ENDED DECEMBER 31, (Amounts in millions) CASH FLOWS FROM OPERATING ACTIVITIES: Net loss Adjustments to reconcile net loss to net cash provided by operating activities: Depreciation and amortization Signing bonus amortization Change in right-of-use assets Deferred income tax expense (benefit) Amortization of debt discount and debt issuance costs Debt extinguishment costs Non-cash compensation and pension expense Signing bonus payments Change in other assets Change in lease liabilities Change in accounts payable and other liabilities Other non-cash items, net Net cash provided by operating activities CASH FLOWS FROM INVESTING ACTIVITIES: Payments for capital expenditures Net cash used in investing activities CASH FLOWS FROM FINANCING ACTIVITIES: Transaction costs for issuance and amendment of debt Principal payments on debt Proceeds from revolving credit facility Payments on revolving credit facility Net proceeds from issuing equity instruments Payments to tax authorities for stock-based compensation Net cash used in financing activities NET CHANGE IN CASH AND CASH EQUIVALENTS CASH AND CASH EQUIVALENTSBeginning of year CASH AND CASH EQUIVALENTS-End of year Supplemental cash flow information: Cash payments for interest Cash payments for taxes, net of refunds (40.8) (54.5) (54.5) (57.8) (57.8) (40.8) (24.3) (31.6) (9.8) (6.5) 23.0 (23.0) (0.7) (7.2) 49.3 146.8 196.1 49.5 (0.8) (7.2) 1.3 145.5 146.8 $ (6.2) (16.0) (44.5) 190.0 145.5 $ $ 77.5 $ (1.8) $ 63.3 $ 4.4 $ 50.7 4.8 2020 2019 2018 1,230.4 $ 54.7 1,285.1 1,398.1 49.5 1,447.6 MONEYGRAM INTERNATIONAL, INC. CONSOLIDATED STATEMENTS OF OPERATIONS FOR THE YEAR ENDED DECEMBER 31, (Amounts in millions, except share data) REVENUE Fee and other revenue $ 1,197.2 $ Investment revenue 20.0 Total revenue 1,217.2 EXPENSES Fee and other commissions expense 603.6 Investment commissions expense 3.6 Direct transaction expense 45.8 Total commissions and direct transaction expenses 653.0 Compensation and benefits 223.8 Transaction and operations support (1) 111.6 Occupancy, equipment and supplies 61.4 Depreciation and amortization 64.4 Total operating expenses 1,114.2 OPERATING INCOME 103.0 Other expenses Interest expense 92.4 Other non-operating expense (income) 4.5 Total other expenses 96.9 Income (loss) before income taxes 6.1 Income tax expense (benefit) 14.0 NET LOSS (7.9) 613.4 23.3 25.5 662.2 228.4 207.8 60.9 73.8 1.233.1 52.0 688.6 19.3 24.3 732.2 259.8 298.8 62.0 76.3 1,429.1 18.5 77.0 39.3 116.3 (64.3) (4.0) (60.3) $ 53.6 (24.2) 29.4 (10.9) 13.1 (24.0) S LOSS PER COMMON SHARE Basic Diluted $ (0.10) $ (0.10) $ (0.85) $ (0.85) $ (0.37) (0.37) $ Weighted average outstanding common shares and equivalents used in computing loss per share Basic Diluted 77.8 77.8 71.1 71.1 64.3 64.3 (1) 2020 and 2019 includes $50.2 million and $11.3 million of related party market development fees, respectively. See Note 20 - Related Parties for further details. MONEYGRAM INTERNATIONAL, INC. CONSOLIDATED STATEMENTS OF COMPREHENSIVE LOSS 2020 2019 2018 $ (7.9) $ (60.3) $ (24.0) (0.4) (0.3) (0.3) FOR THE YEAR ENDED DECEMBER 31, (Amounts in millions) NET LOSS OTHER COMPREHENSIVE INCOME|(LOSS) Net change in unrealized holding loss on available-for-sale securities arising during the period, net of tax benefit of $0.1, $0.0 and $0.0 for the years ended December 31, 2020, 2019 and 2018, respectively Net change in pension liability due to amortization of prior service credit and net actuarial loss, net of tax benefit of $0.5, $0.7 and $1.0 for the years ended December 31, 2020, 2019 and 2018, respectively Pension settlement charge, net of tax benefit of $7.2 for the year ended December 31, 2019 Valuation adjustment for pension and postretirement benefits, net of tax (benefit) expense of $(1.0), $(2.0) and $1.8 for the years ended December 31, 2020, 2019 and 2018, respectively Unrealized non-U.S. dollar translation adjustments, net of tax expense (benefit) of $0.2, $(0.3) and $0.0 for the years ended December 31, 2020, 2019 and 2018, respectively Other comprehensive income (loss) COMPREHENSIVE LOSS 1.7 2.1 3.5 24.1 (3.4) (6.6) 6.1 7.2 5.1 (2.8) $ (0.2) 19.1 (41.2) $ (13.8) (4.5) (28.5) $ THE WESTERN UNION COMPANY CONSOLIDATED BALANCE SHEETS (in millions, except per share amounts) December 31, 2020 2019 $ $ 1,428.2 3,821.4 1,450.5 3,296.7 150.4 186.9 2,566.6 2,566.6 Assets Cash and cash equivalents Settlement assets. Property and equipment, net of accumulated depreciation of $659.9 and $616.5, respectively Goodwill Other intangible assets, net of accumulated amortization of $1,044.6 and $961.5, respectively Other assets Total assets. Liabilities and stockholders' equity/(deficit) Liabilities: Accounts payable and accrued liabilities Settlement obligations Income taxes payable. Deferred tax liability, net Borrowings Other liabilities Total liabilities 505.0 1,024.7 9,496.3 494.9 762.9 8,758.5 $ $ $ 500.9 3,821.4 928.9 188.9 3,067.2 802.4 9,309.7 601.9 3,296.7 1,019.7 152.1 3,229.3 498.3 8,798.0 Commitments and contingencies (Note 6) Stockholders' equity/(deficit): Preferred stock, $1.00 par value; 10 shares authorized; no shares issued. Common stock, $0.01 par value; 2,000 shares authorized; 411.2 shares and 418.0 shares issued and outstanding as of December 31, 2020 and December 31, 2019, respectively Capital surplus Accumulated deficit Accumulated other comprehensive loss Total stockholders' equity/(deficit). Total liabilities and stockholders' equity/(deficit). 4.1 885.1 (543.1) (159.5) 186.6 9,496.3 4.2 841.2 (675.9) (209.0) (39.5) 8,758.5 $ See Notes to Consolidated Financial Statements. THE WESTERN UNION COMPANY CONSOLIDATED STATEMENTS OF CASH FLOWS (in millions) Year Ended December 31, 2020 2019 2018 $ 744.3 $ 1,058.3 $ 851.9 61.3 164.3 76.9 187.8 79.6 178.1 (532.1) (24.5) 118.4 13.9 145.8 (15.1) 66.2 7.5 94.3 (44.4) (96.6) (94.4) (16.7) (36.8) (28.2) 914.6 (31.0) (126.5) (193.1) 4.2 821.3 877.5 (69.1) (51.2) (36.5) (46.6) (33.0) (48.1) (150.3) (52.0) (136.7) 49.4 Cash flows from operating activities Net income... Adjustments to reconcile net income to net cash provided by operating activities: Depreciation Amortization. Gain on divestitures of businesses, excluding transaction costs (Note 5) Deferred income tax provision/(benefit) (Note 11).. Other non-cash items, net Increase/(decrease) in cash, excluding the effects of divestitures, resulting from changes in: Other assets. Accounts payable and accrued liabilities Income taxes payable (Note 11) Other liabilities.... Net cash provided by operating activities Cash flows from investing activities Payments for capitalized contract costs. Payments for internal use software Purchases of property and equipment Proceeds from the sale of former corporate headquarters and other property (Note 5). Proceeds from divestitures of businesses, net of cash divested (Note 5) Purchases of non-settlement related investments. Proceeds from maturity of non-settlement related investments. Purchases of held-to-maturity non-settlement related investments. Proceeds from held-to-maturity non-settlement related investments Other investing activities Net cash (used in)/provided by investing activities Cash flows from financing activities Cash dividends and dividend equivalents paid. Common stock repurchased (Note 14) Net (repayments of)/proceeds from commercial paper Net proceeds from issuance of borrowings. Principal payments on borrowings Proceeds from exercise of options. Other financing activities.... Net cash used in financing activities .. Net change in cash, cash equivalents, and restricted cash. Cash, cash equivalents, and restricted cash at beginning of period Cash, cash equivalents, and restricted cash at end of period Supplemental cash flow information: Interest paid... Income taxes paid Cash paid for lease liabilities Non-cash lease liabilities arising from obtaining right-of-use assets (Note 13)... Restricted cash at end of period (included in Other assets) (4.9) 0.9 711.7 (6.8) 23.4 (1.3) 33.0 (24.2) 13.7 (2.8) 23.5 (2.0) (113.4) 632.3 (328.8) (370.3) (239.7) (165.0) 2.2 (0.7) (773.5) (9.4) 1,456.8 $ 1,447.4 (340.8) (552.6) 120.0 495.9 (824.9) 36.7 (4.1) (1,069.8) 477.1 979.7 1,456.8 (341.7) (412.4) 125.0 685.4 (414.4) 10.1 (9.2) (357.2) 135.3 844.4 $ 979.7 $ 109.6 $ $ 187.3 $ $ 65.9 $ S 38.6 $ $ 19.2 $ 151.3 318.9 53.8 269.1 6.3 $ 142.5 $ 339.4 $ $ $ 6.3 See Notes to Consolidated Financial Statements. THE WESTERN UNION COMPANY CONSOLIDATED STATEMENTS OF INCOME (in millions, except per share amounts) Year Ended December 31, 2020 2019 2018 $ 4,835.0 $ 5,292.1 $5,589.9 2,826.5 1,041.2 3,867.7 967.3 3,086.5 1,271.6 4,358.1 934.0 3,300.8 1,167.0 4,467.8 1,122.1 Revenues Expenses: Cost of services. Selling, general, and administrative Total expenses (a) Operating income Other income/expense): Gain on divestitures of businesses (Note 5) Interest income Interest expense. Other income, net Total other income/expense), net Income before income taxes. Provision for income taxes Net income.. Earnings per share: Basic Diluted. Weighted average shares outstanding: Basic Diluted. 3.2 (118.5) 3.1 (112.2) 855.1 110.8 744.3 524.6 6.3 (152.0) 8.5 387.4 1,321.4 263.1 $ 1,058.3 4.8 (149.6) 14.1 (130.7) 991.4 139.5 $ 851.9 $ $ 1.81 1.79 $ $ 2.47 2.46 $ $ 1.89 1.87 412.3 415.2 427.6 430.9 451.8 454.4 (a) As further described in Note 7, total expenses include amounts incurred with related parties of $54.6 million, $57.1 million, and $57.6 million for the years ended December 31, 2020, 2019, and 2018, respectively. See Notes to Consolidated Financial Statements. THE WESTERN UNION COMPANY CONSOLIDATED STATEMENTS OF COMPREHENSIVE INCOME (in millions) Year Ended December 31, 2020 2019 2018 $ 744.3 $ 1,058.3 $ 851.9 33.6 (26.9) 25.8 (11.0) Net income.. Other comprehensive income, net of reclassifications and tax (Note 14): Unrealized gains/(losses) on investment securities Unrealized gains/(losses) on hedging activities Foreign currency translation adjustments . Defined benefit pension plan adjustments (Note 12). Total other comprehensive income Comprehensive income.. (4.3) 50.3 (19.5) 1.8 28.3 $ 880.2 42.8 49.5 $ 793.8 7.2 22.0 $ 1,080.3 See Notes to Consolidated Financial Statements
Step by Step Solution
There are 3 Steps involved in it

Get step-by-step solutions from verified subject matter experts