

Question: Can someone please help with these components? in C, trying to write a program to simulate student grades and show statistics. Having trouble using functions.
Can someone please help with these components? in C, trying to write a program to simulate student grades and show statistics. Having trouble using functions. Thank you!
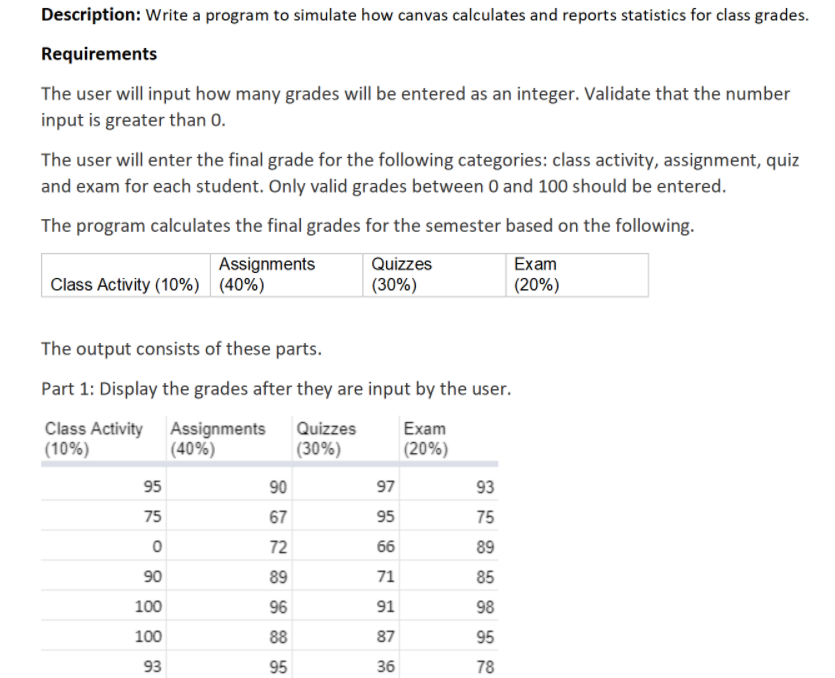
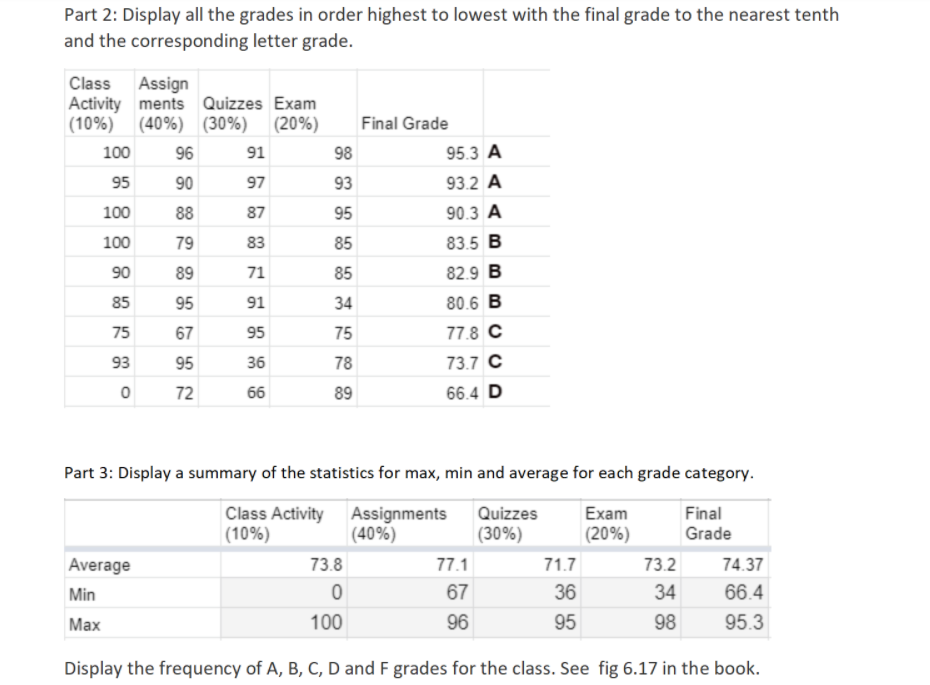
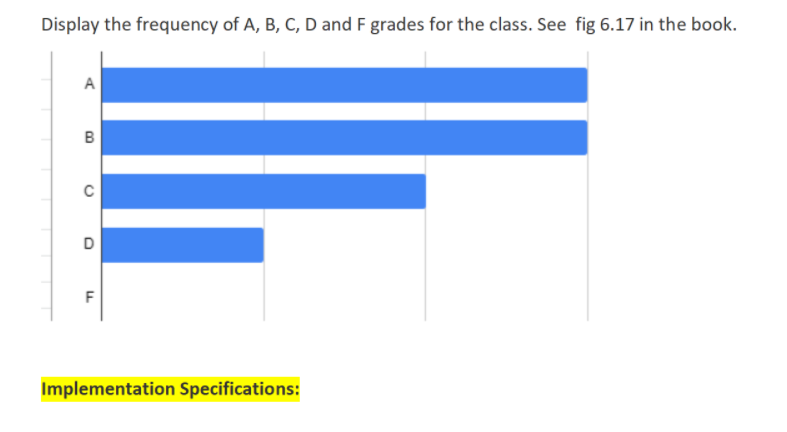
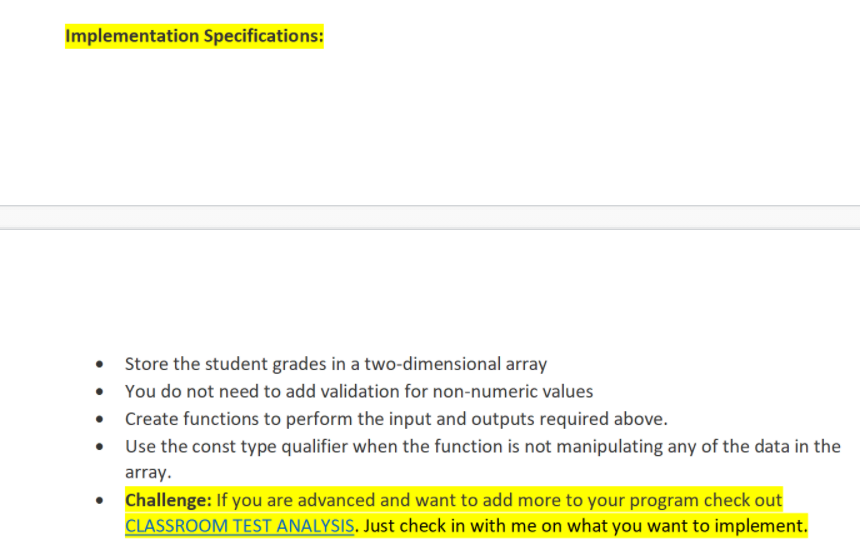
Description: Write a program to simulate how canvas calculates and reports statistics for class grades. Requirements The user will input how many grades will be entered as an integer. Validate that the number input is greater than 0. The user will enter the final grade for the following categories: class activity, assignment, quiz and exam for each student. Only valid grades between 0 and 100 should be entered. The program calculates the final grades for the semester based on the following. Assignments Quizzes Exam Class Activity (10%) (40%) (30%) (20%) The output consists of these parts. Part 1: Display the grades after they are input by the user. Class Activity Assignments Quizzes Exam (10%) (40%) (30%) (20%) % 95 90 97 93 75 95 75 0 72 66 89 90 89 71 100 96 91 98 100 88 95 93 95 67 85 87 36 78 Part 2: Display all the grades in order highest to lowest with the final grade to the nearest tenth and the corresponding letter grade. Class Assign Activity ments Quizzes Exam (10%) (40%) (30%) (20%) 100 96 91 95 90 97 100 88 87 100 79 83 90 89 71 85 91 75 67 95 93 36 0 72 66 98 93 95 85 Final Grade 95.3 A 93.2 A 90.3 A 83.5 B 82.9 B 80.6 B 77.8 C 73.7 C 66.4 D 85 95 34 75 78 95 89 Part 3: Display a summary of the statistics for max, min and average for each grade category. Class Activity Assignments Quizzes Exam Final (10%) (40%) (30%) (20%) Grade Average 73.8 77.1 71.7 73.2 74.37 Min 0 67 36 34 66.4 Max 100 96 95 98 95.3 Display the frequency of A, B, C, D and F grades for the class. See fig 6.17 in the book. Display the frequency of A, B, C, D and F grades for the class. See fig 6.17 in the book. A B D F Implementation Specifications: Implementation Specifications: Store the student grades in a two-dimensional array You do not need to add validation for non-numeric values Create functions to perform the input and outputs required above. Use the const type qualifier when the function is not manipulating any of the data in the array. Challenge: If you are advanced and want to add more to your program check out CLASSROOM TEST ANALYSIS. Just check in with me on what you want to implement. Description: Write a program to simulate how canvas calculates and reports statistics for class grades. Requirements The user will input how many grades will be entered as an integer. Validate that the number input is greater than 0. The user will enter the final grade for the following categories: class activity, assignment, quiz and exam for each student. Only valid grades between 0 and 100 should be entered. The program calculates the final grades for the semester based on the following. Assignments Quizzes Exam Class Activity (10%) (40%) (30%) (20%) The output consists of these parts. Part 1: Display the grades after they are input by the user. Class Activity Assignments Quizzes Exam (10%) (40%) (30%) (20%) % 95 90 97 93 75 95 75 0 72 66 89 90 89 71 100 96 91 98 100 88 95 93 95 67 85 87 36 78 Part 2: Display all the grades in order highest to lowest with the final grade to the nearest tenth and the corresponding letter grade. Class Assign Activity ments Quizzes Exam (10%) (40%) (30%) (20%) 100 96 91 95 90 97 100 88 87 100 79 83 90 89 71 85 91 75 67 95 93 36 0 72 66 98 93 95 85 Final Grade 95.3 A 93.2 A 90.3 A 83.5 B 82.9 B 80.6 B 77.8 C 73.7 C 66.4 D 85 95 34 75 78 95 89 Part 3: Display a summary of the statistics for max, min and average for each grade category. Class Activity Assignments Quizzes Exam Final (10%) (40%) (30%) (20%) Grade Average 73.8 77.1 71.7 73.2 74.37 Min 0 67 36 34 66.4 Max 100 96 95 98 95.3 Display the frequency of A, B, C, D and F grades for the class. See fig 6.17 in the book. Display the frequency of A, B, C, D and F grades for the class. See fig 6.17 in the book. A B D F Implementation Specifications: Implementation Specifications: Store the student grades in a two-dimensional array You do not need to add validation for non-numeric values Create functions to perform the input and outputs required above. Use the const type qualifier when the function is not manipulating any of the data in the array. Challenge: If you are advanced and want to add more to your program check out CLASSROOM TEST ANALYSIS. Just check in with me on what you want to implement
Step by Step Solution
There are 3 Steps involved in it

Get step-by-step solutions from verified subject matter experts